9 - Data entry: data input techniques
Describe and explain standard spatial (and non-spatial) data input techniques (non RS) including the management of the data collection process (level 1 and 2).
Concepts
-
Spatial data acquisition
Spatial data can be obtained from various sources. It can be collected from scratch, using direct spatial-data acquisition techniques, or indirectly, by making use of existing spatial data collected by others. The first source could include field survey data and remotely sensed images. To the second source belong printed maps and existing digital data sets.
-
Digitizing
A traditional method of obtaining spatial data is through digitizing existing printed maps. This can be done using on-tablet and on-screen manual digitizing. Before adopting this approach, one must be aware that positional errors already on the map will further accumulate and that one must be willing to accept these errors.
-
Field survey
Field surveys of natural and water resources are frequently carried out to check and supplement information derived from the interpretation of aerial photographs and satellite imagery (Figure below). Often, sample areas are chosen within a study area for more detailed investigations. Socio-economic data, however, are often collected on the basis of administrative districts, with the result that their location is insufficiently precise to permit analysis of high quality.

Figure: Field workers checking and collecting supplementary information in the field. -
Terrestrial surveys
Terrestrial surveys are usually employed for details that must be measured accurately, e.g. survey control stations, property boundaries, buildings, and road construction works (Figure below). The surveyed data are often used to supplement and update existing data and for verification of data collected from aerial surveys and by satellite remote sensing. A terrestrial survey records features showing their relative position both horizontally and vertically. Several surveying techniques are employed to do this.

Terrestrial surveys are used to map details such as property boundaries. -
Horizontal positioning
In horizontal positioning, measured angles at, and at distances from, known points are used to determine the positions of other points. Traditionally, survey measurements were made with optical and mechanical surveying instruments, such as a theodolite to measure angles, and more accurate electronic and electro-optical devices such as lasers for measuring distances. A more modern instrument is a total station, which is a theodolite with an electronic distance measurement device. Since the introduction of total stations, there has been a technological shift from the use of optical-mechanical devices to fully electronic systems incorporating a computer and relevant software.
Though satellite receivers are used for terrestrial surveying, total stations are still used widely, along with other types of surveying instruments, because of their accuracy, and area of operation: satellite systems do not work well in areas with dense tree cover or a high density of buildings.
-
Mobile GIS
Until recently, printed maps and forms were taken to the field and the information collected was sketched as notes on the map or written down on a form. This information was entered into a GIS database after returning to the office. This method of data collection is inefficient and prone to error. With a mobile GIS system and the support of a satellite receiver, we can take a
GIS into the field with us on powerful, compact mobile computers and view, capture and update information, and then synchronize changes between the field and office (Figure 1).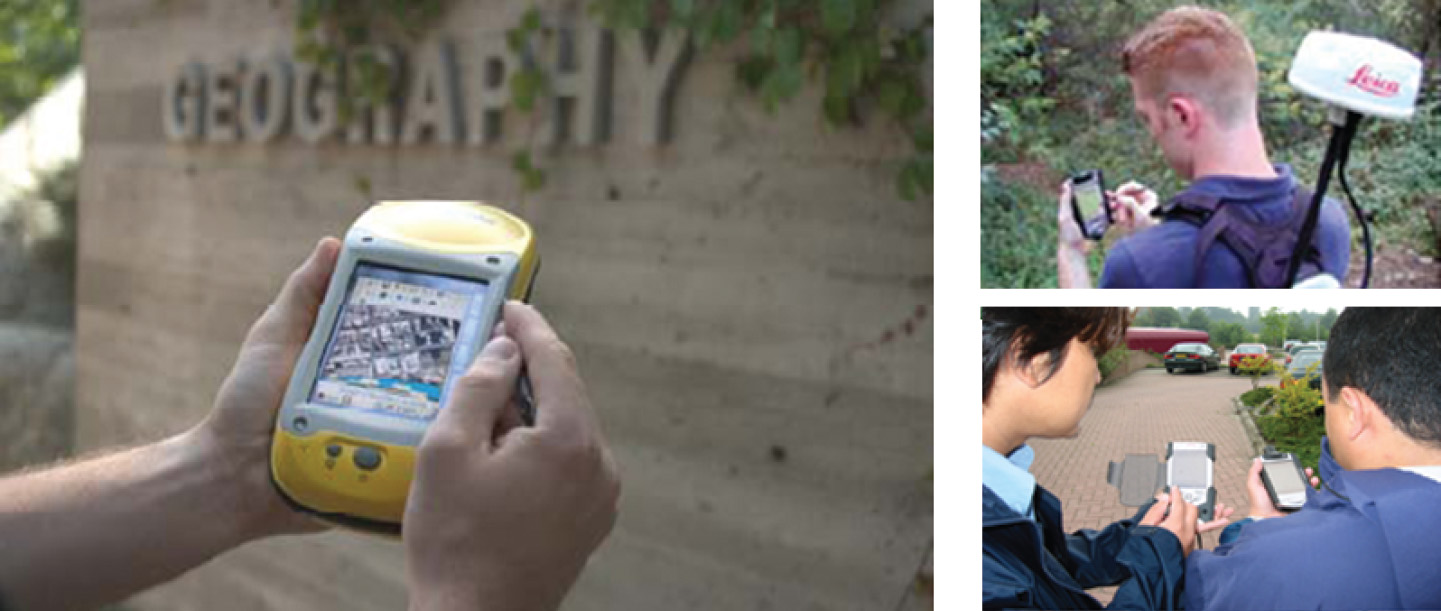
Figure 1: Mobile GIS provides the integration of mapping, GIS and positioning to field users via hand-held and mobile devices -
Remote sensing
Satellite remote sensing is an important source of spatial data. For this, satellites use different sensor packages to passively measure reflectance of parts of the electromagnetic spectrum or radio waves that were emitted by an active sensor such as radar. Remote sensing collects raster data that can be further processed using different wavelength bands to identify objects and classes of interest, e.g. land cover.
-
Scanning
A scanned image of the original map is needed for on-screen manual digitizing and semi-automatic/automatic digitizing. A range of scanners are available for obtaining a scanned image, starting from a small-format (
A4 ) desktop scanner with resolutions of 200–800 dpi, through to high-end flatbed and drum scanners (see Figure below) suitable for very accurate scanning of large-sized documents (A0 ).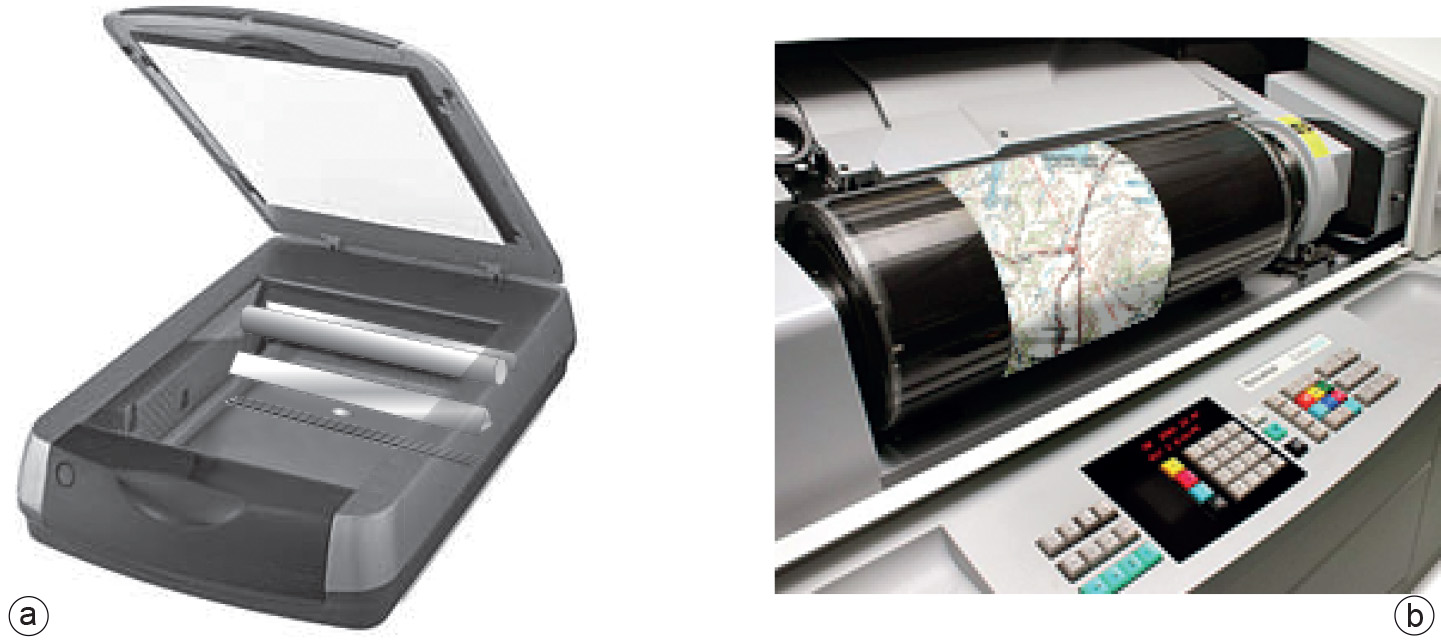
Figure: Main types of scanners: (a) a flatbed scanner, (b) a drum scanner. -
Vertical positioning
Vertical positioning is usually done by levelling, which is a technique for measuring differences in height between established points relative to a datum or base point. Over short distances, levelling telescopes are used to view a staff or pole and, with the aid of a bar code, the height is recorded in relation to the previous station.
Elevation heights can also be derived with satellite receivers, albeit usually with somewhat less accuracy than for traditional precise levelling. However, the accuracy of satellite receivers may be similar if traditional levelling has to be used over a long distance. Laser altimetry is employed for large areas, but its accuracy is not as good as levelling or
GPS . -
Aerial survey
Aerial photographs are a major source of digital data; soft-copy workstations are used to digitize features directly from stereo pairs of digital photographs. These systems allow data to be captured in two or three dimensions, with elevations measured directly from a stereo pair using the principles of photogrammetry. Analogue aerial photos are often scanned before being entered into a soft-copy system, but with the advance of high-quality digital cameras this step can now be skipped.
In general, the alignment of roads and railways, lakes and water, and shapes of buildings are easily interpreted on aerial photographs - assuming that the scale of the photographs is not too small. Also, constructions such as dikes, bridges, air fields and the main types of vegetation and cultivation are mostly clearly visible. Nevertheless, numerous attribute data related to terrain features cannot be interpreted on aerial photographs: e.g. the administrative qualification of roads, sea and lake depths, functions of buildings, street names, and administrative boundaries. We will have to collect this information in the field or from existing data sets and maps (e.g. road maps, navigational charts or town plans).
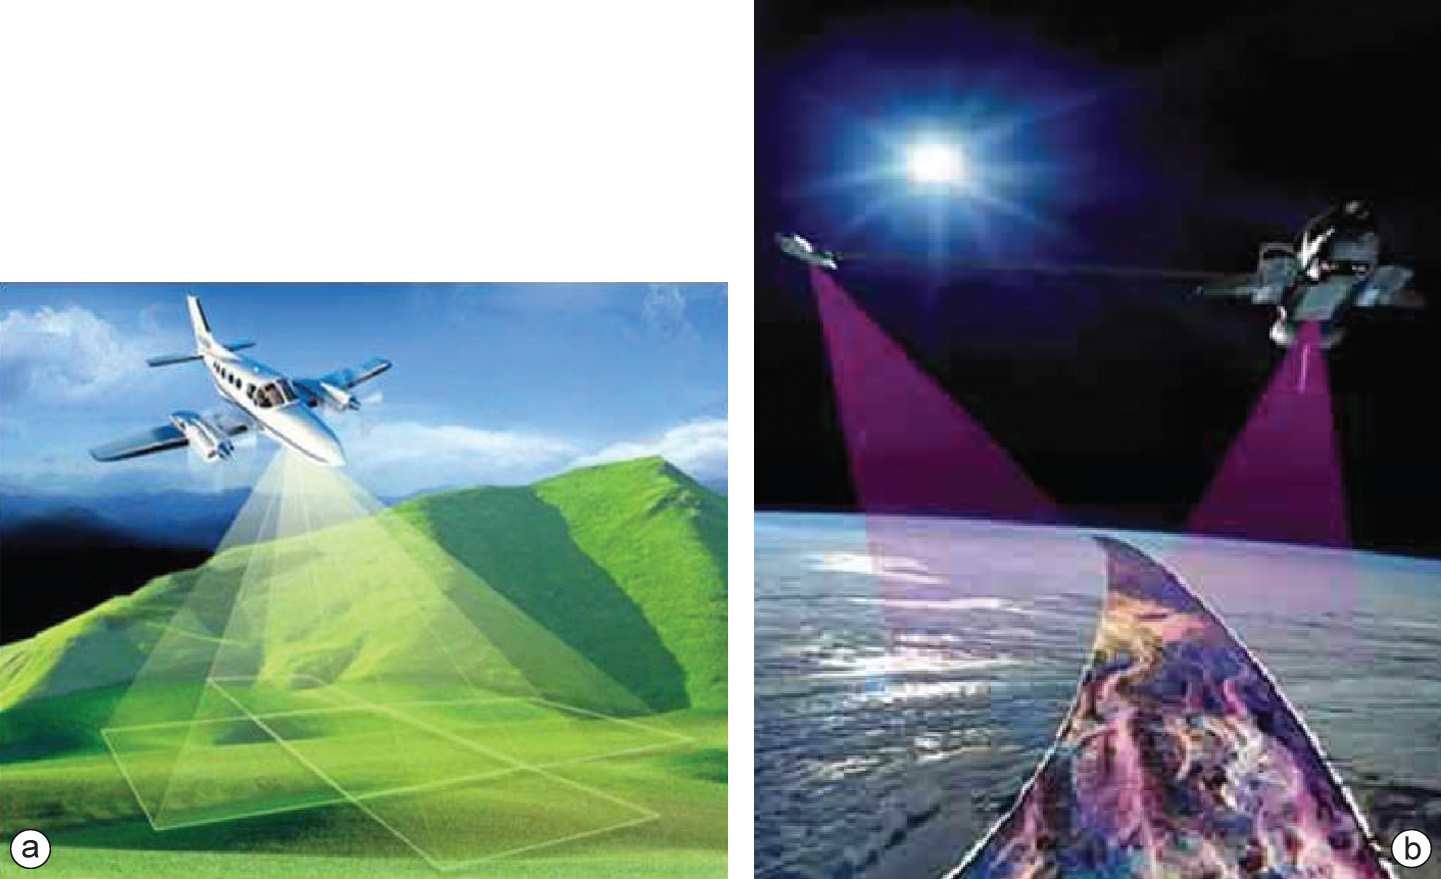
Figure: Aerial surveys (a) and satellite remote sensing (b) are employed to map relatively large areas at comparably large scales, source : Shuttle Radar Topography Mission, U.S. Geological Survey Department of the Interior/USGS and NASA, JPL. -
Data preparation
Spatial data preparation aims to make acquired spatial data fit for use. Images may require enhancements and corrections of the classification scheme of the data. Vector data also may require editing, such as the trimming of line overshoots at intersections, deleting duplicate lines, closing gaps in lines, and generating polygons. Data may require conversion to either vector or raster formats to match other data sets that will be used in analyses. Additionally, the data preparation process includes associating attribute data with the spatial features through either manual input or reading digital attribute files into the
GIS /DBMS .The intended use of the acquired spatial data may require a less-detailed subset of the original data set, as only some of the features are relevant for subsequent analysis or subsequent map production. In these cases, data and/or cartographic generalization can be performed on the original data set.
-
Vectorization
Another set of techniques also works from a scanned image of the original map, but uses a GIS to find features in the image. These techniques are known as semi-automatic or automatic digitizing, depending on how much operator interaction is required. If vector data are to be distilled from this procedure, a process known as Vectorization follows the scanning process. This procedure is less labour-intensive but can only be applied for relatively simple sources.
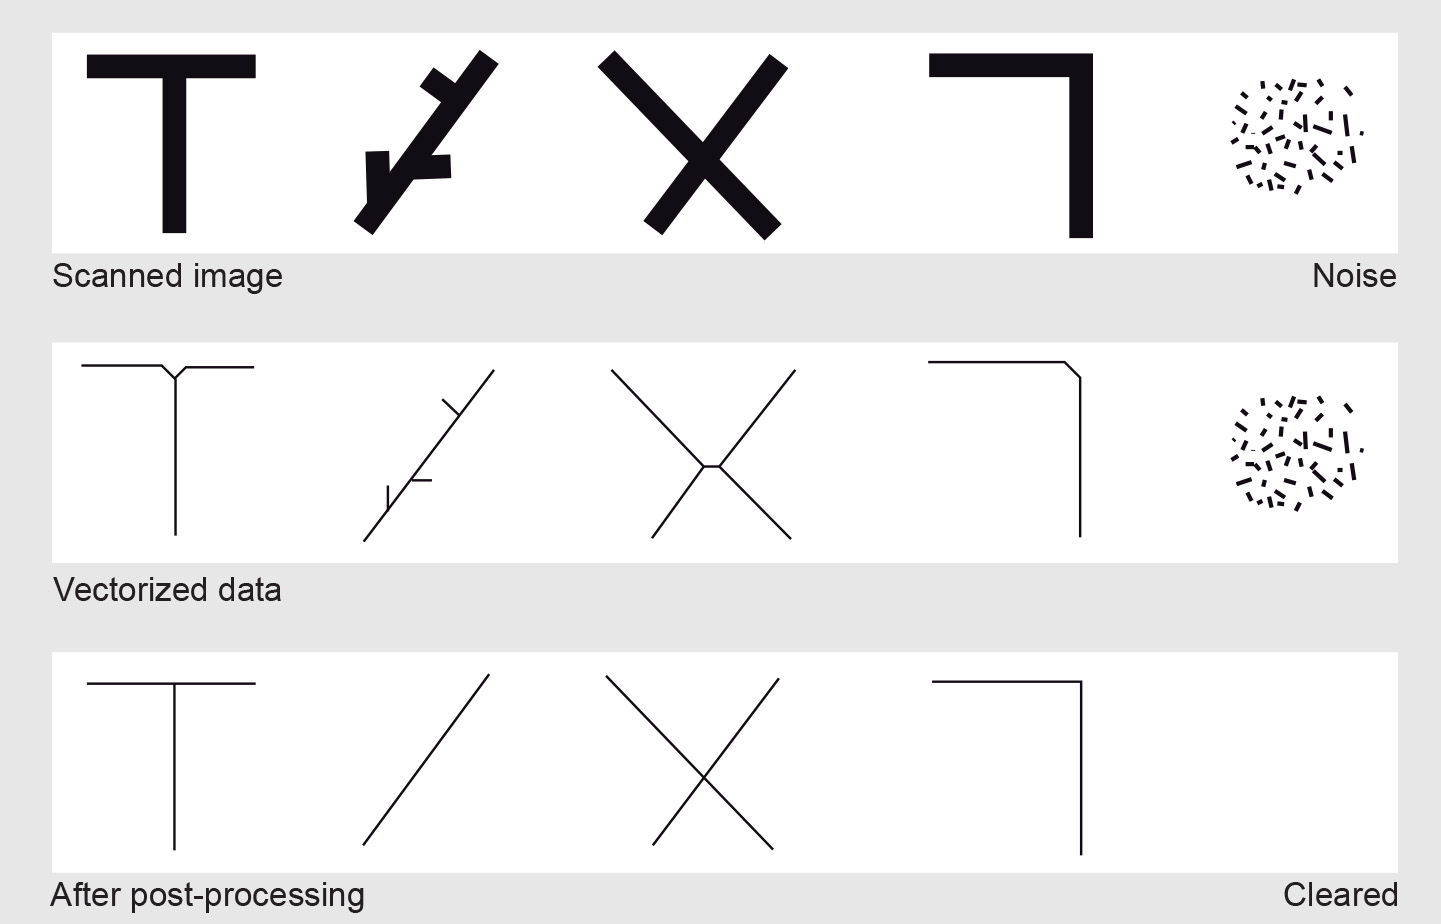
Figure: The phases of the vectorization process and various sorts of minor errors resulting from it. These are repaired in a post-processing phase. The process of distilling points, lines and polygons from a scanned image is called vectorization. Vectorization produces a vector data set from a raster. Another form of vectorization is used when we want to identify features or patterns in remotely sensed images.
As scanned lines may be several pixels wide, they are often first thinned to retain only the centreline. The remaining centreline pixels are converted to series of (x, y) coordinate pairs, defining a polyline. Subsequently, features are formed and attributes are attached to them. This process may be entirely automated or performed semi-automatically, with the assistance of an operator. Pattern recognition methods - like Optical Character Recognition (OCR) for text - can be used for the automatic detection of graphic symbols and text.
Vectorization causes errors such as small spikes along lines, rounded corners, errors in T- and X-junctions, displaced lines or jagged curves. These errors are corrected in an automatic or interactive post-processing phase. The phases of the vectorization process are illustrated in Figure above.