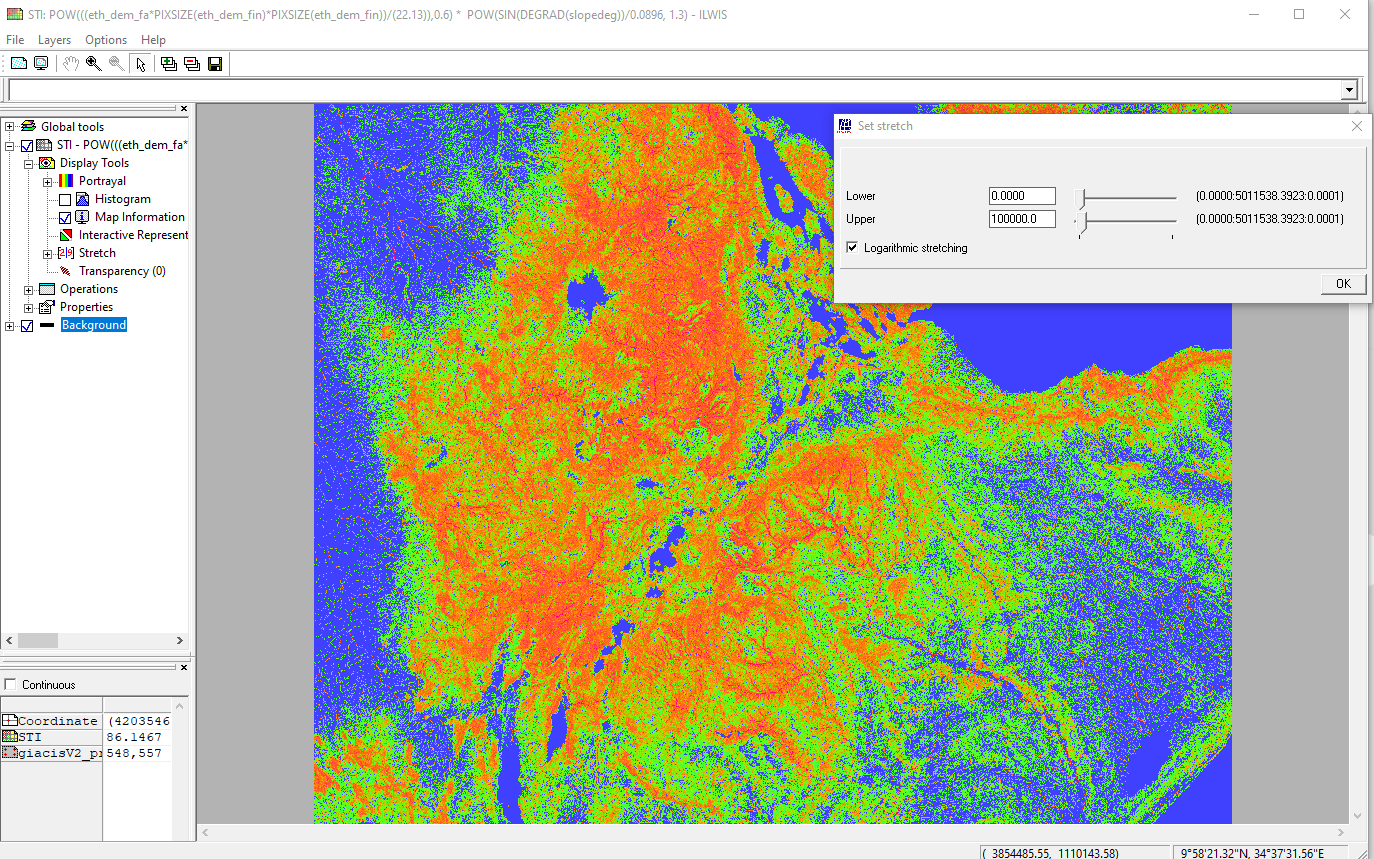
Sediment Transport Index map
Explanation
Check the result obtained. To improve the visualization of the map, under “Display Tools”, double click the option “Stretch”, activate the ‘Logarithmic stretching’ option. What do the map values represent?
Examples
Outgoing relations
- Sediment Transport Index map input Cap STI Values
Incoming relations
- Calculate Sediment Transport Index output Sediment Transport Index map