Triangulated Irregular Networks
Introduction
Triangulated Irregular Networks (TINs) is a commonly-used data structure in GIS software. It is a standard implementation techniques for digital terrain models, but it can also be used to represent any continuous field. The principles on which a TIN is based are simple. It is built from a set of locations for which we have a measurement, for instance an elevation. The locations can be arbitrarily scattered in space and are not usually on a regular grid. Any location together with its elevation value can be viewed as a point in three-dimensional space. From these 3D points, we can construct an irregular tessellation made of triangles.
Explanation
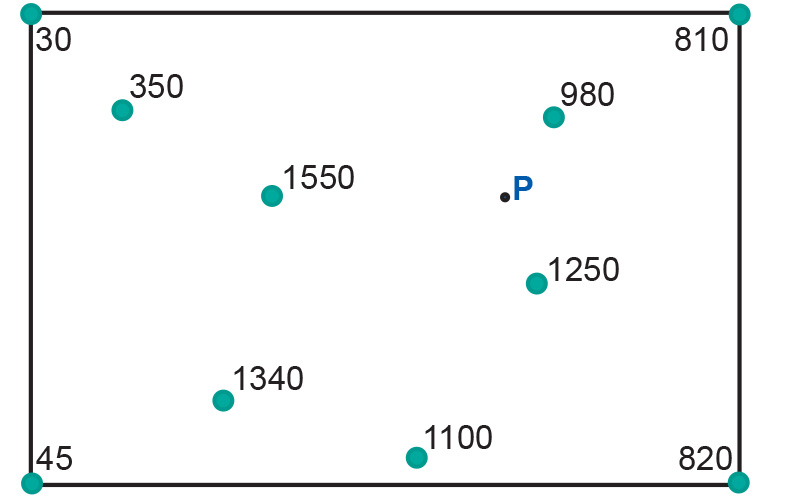
In three-dimensional space, three points uniquely determine a plane, as long as they are not collinear, i.e. they must not be positioned on the same line. A plane fitted through these points has a fixed aspect and gradient and can be used to compute an approximation of elevation of other locations. Since we can pick many triples of points, we can construct many such planes, and therefore we can have many elevation approximations for a single location, such as P (Figure 1).

By restricting the use of a plane to the triangular area “between” the three anchor points, we obtain a triangular tessellation of the complete study space. Unfortunately there are many different tessellations for a given input set of anchor points, as Figure 2 shows. Some tessellations are better than others, in the sense that they give smaller errors of elevation approximation. For instance, if we base our elevation computation for location P on the shaded triangle in the left-hand diagram, we will get a different value than that from the shaded triangle in the right-hand diagram. The latter will provide a better approximation because the average distance from P to the three triangle anchors is smaller.

The triangulation of Figure 2b is a Delaunay Triangulation, which in a sense is an optimal triangulation. There are several ways of defining such a triangulation (see Preparata and Shamos, 1985). Two important properties are, first, that the triangles are as equilateral (‘equal-sided’) as they can be, given the set of anchor points and, second, that for each triangle, the circumcircle through its three anchor points does not contain any other anchor point. One such circumcircle is depicted on the right of Figure 2b. A TIN clearly is a vector representation: each anchor point has a stored georeference. Yet we might also call it an irregular tessellation, as the chosen triangulation provides a partitioning of the entire study space. However, in this case, the cells do not have an associated stored value as is typical of tessellations, but rather a simple interpolation function that uses the elevation values of its three anchor points.
Synonyms
TIN
External resources
Learning outcomes
-
2 - Spatial data modelling: computer representations
Explain and be able to apply basic vector and raster spatial data structures including selecting a suitable data structure for geographic phenomena (level 1, 2 and 3).
Prior knowledge
Outgoing relations
- Triangulated Irregular Networks is a kind of Vector Representation
- Triangulated Irregular Networks is used by Surface Analysis
Incoming relations
- Thiessen Polygons is produced by Triangulated Irregular Networks