Map scale
Introduction
In the practice of spatial data handling, one often comes across questions like “What is the resolution of the data?” or “At what scale is your data set?” Now that we have moved firmly into the digital age, these questions sometimes defy an easy answer. Map scale can be defined as the ratio between the distance on a printed map and the distance of the same stretch in the terrain.
A 1:50,000 scale map means that 1 cm on the map represents 50,000 cm (i.e. 500 m) in the terrain. “Large-scale” means that the ratio is relatively large, so typically it means there is much detail to see, as on a 1:1000 printed map. “Small-scale”, in contrast, means a small ratio, hence less detail, as on a 1:2,500,000 printed map.
Explanation
Digital spatial data, as stored in a GIS, are essentially without scale: scale is a ratio notion associated with visual output, such as a map or on-screen display, not with the data that was used to produce the map or display. When digital spatial data sets have been collected with a specific map-making purpose in mind, and all maps have been designed to use one single map scale, for instance 1:25,000, we may assume that the data carries the characteristic of “a 1:25,000 digital data set.”
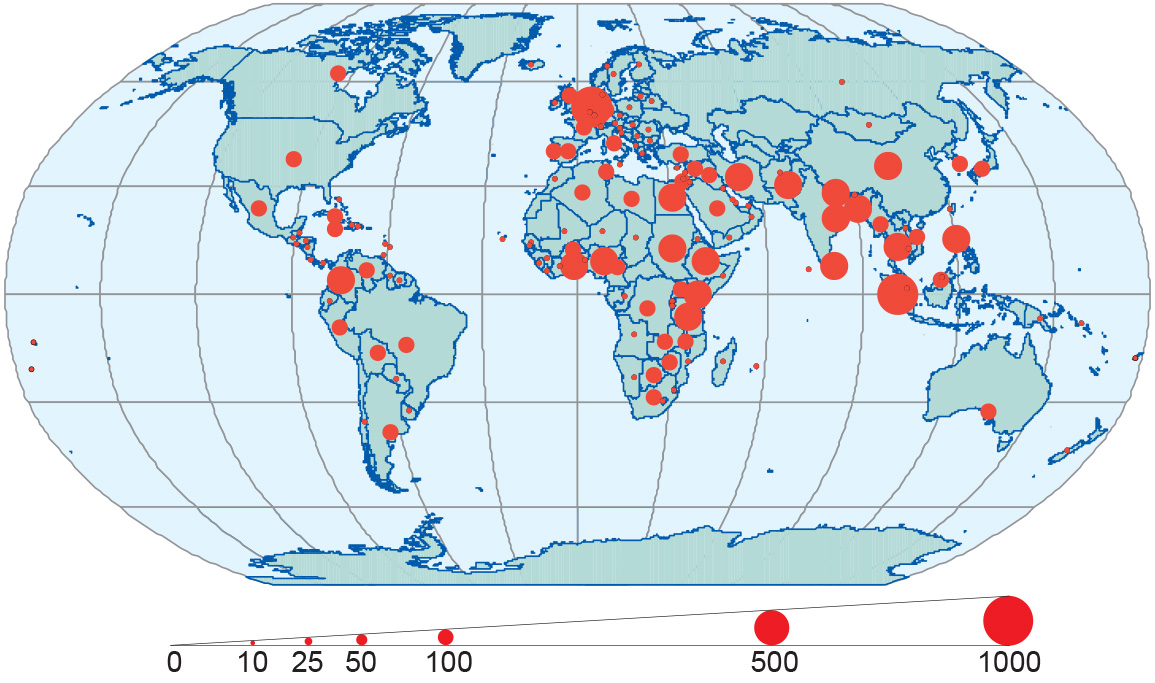
There is a relationship between the effectiveness of a map for a given purpose and the map’s scale. The PublicWorks department of a city council cannot use a 1:250,000 map for replacing broken sewer pipes, and the map of Figure 1 cannot be reproduced at scale 1:10,000.
Maps that show much detail of a small area are called large-scale maps. Scale indications on maps can be given verbally, such as “one-inch-tothe- mile”, or as a representative fraction like 1:200,000,000 (1 cm on the map equals 200,000,000 cm (or 2000 km) in reality), or by a graphic representation such as the scale bar. The advantage of using scale bars in digital environments is that its length also changes when the map is zoomed in, or enlarged, before printing. Sometimes it is necessary to convert maps from one scale to another, which may lead to problems of cartographic generalization.
Examples
The world map in Figure 1 is a small scale map.
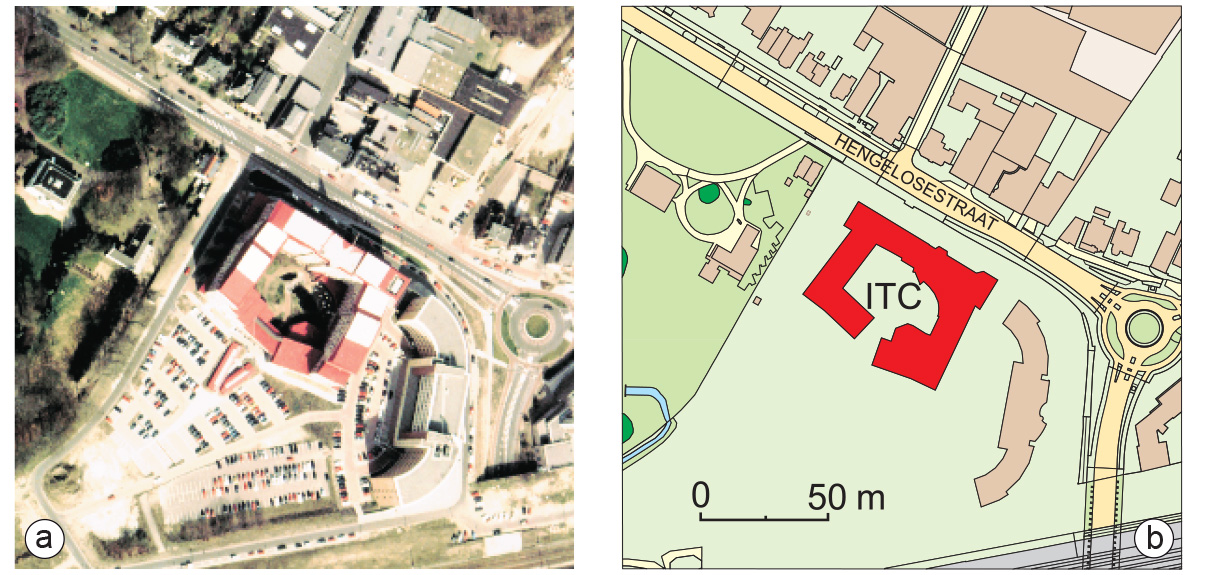
The map in Figure 2b displaying the surroundings of the ITC building is an example of a large-scale map.
Learning outcomes
-
2 - Spatial data modelling: computer representations
Explain and be able to apply basic vector and raster spatial data structures including selecting a suitable data structure for geographic phenomena (level 1, 2 and 3).
Prior knowledge
Outgoing relations
- Map scale is a property of Map
- Map scale is used by Geographical representation