Line representation
Introduction
Line data are used to represent one-dimensional objects such as roads, railroads, canals, rivers and power lines. Again, there is an issue of relevance for the application and the scale that the application requires.
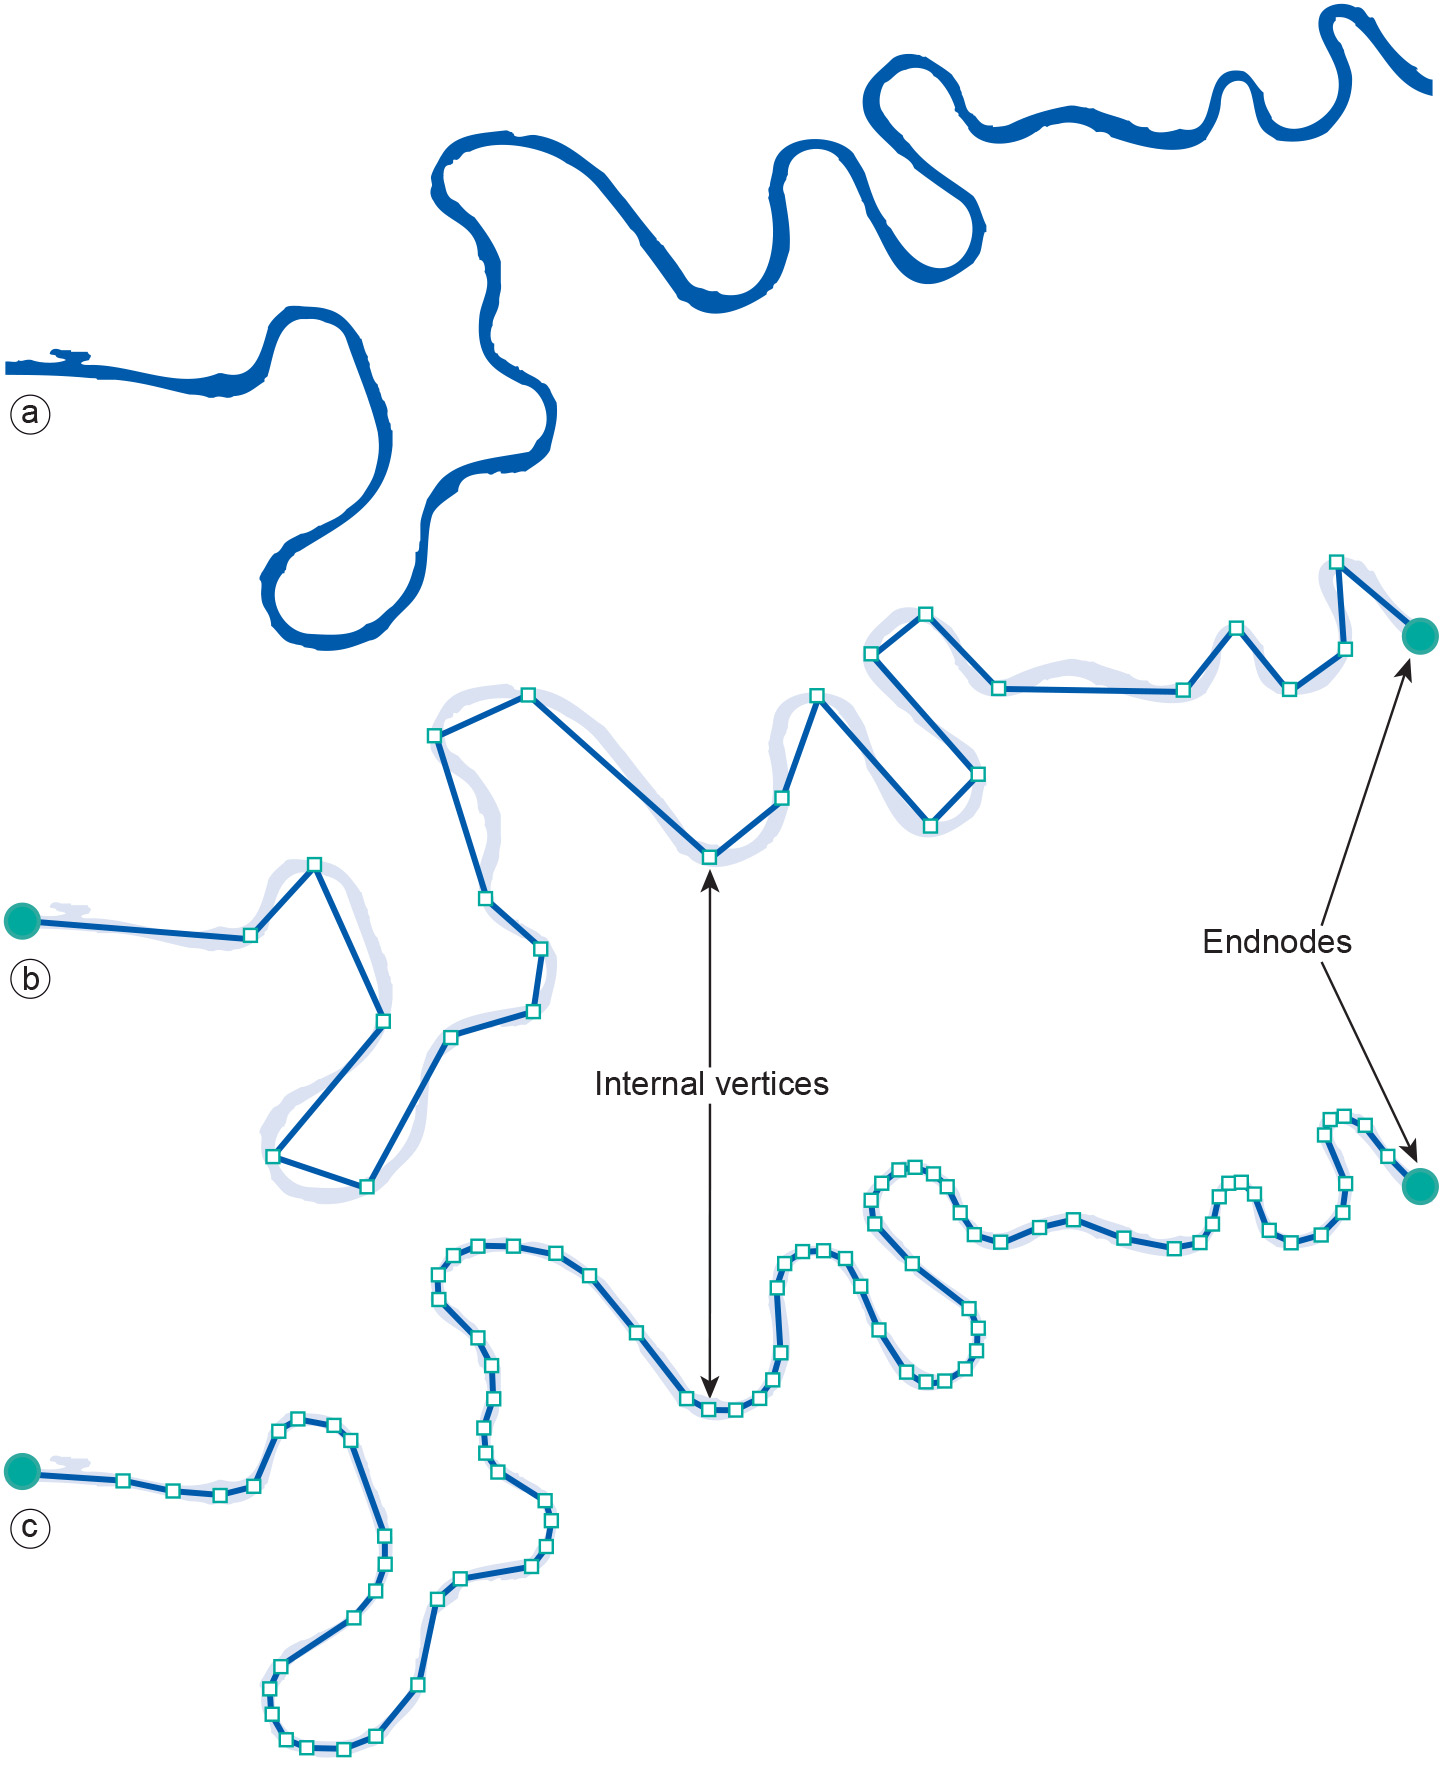
For the example of mapping tourist information, bus, subway and tram routes are likely to be relevant line features. Some cadastral systems, on the other hand, may consider roads to be two-dimensional features, i.e. having a width as well as length. Previously, we noted that arbitrary, continuous curvilinear features are as equally difficult to represent as continuous fields. GISs, therefore, approximate such features (finitely!) as lists of nodes: the two end nodes and zero or more internal nodes, or vertices, define a line. Other terms for “line” that are commonly used in some GISs are polyline, arc or edge. A node or vertex is like a point, but it only serves to define the line and provide shape in order to obtain a better approximation of the actual feature. The straight parts of a line between two consecutive vertices or end nodes are called line segments. Many GISs store a line as a sequence of coordinates of its end nodes and vertices, assuming that all its segments are straight. This is usually good enough, as cases in which a single straight line segment is considered an unsatisfactory representation can be dealt with by using multiple (smaller) line segments, instead of one.
Still, in some cases we would like to have the opportunity to use arbitrary curvilinear features to represent real-world phenomena. Think of a garden design with perfectly circular or elliptical lawns, or of detailed topographic maps showing roundabouts and the sidewalks. In principle all of this can be stored in a GIS, but currently many systems do not accommodate such shapes. A GIS function supporting curvilinear features uses parameterized mathematical descriptions, a discussion of which is beyond the scope of this textbook. Collections of (connected) lines may represent phenomena that are best viewed as networks. With networks, interesting questions arise that have to do with connectivity and network capacity. These relate to applications such as traffic monitoring and watershed management. With network elements—i.e. the lines that make up the network—extra values are commonly associated, such as distance, quality of the link or the carrying capacity.
Examples
Learning outcomes
-
2 - Spatial data modelling: computer representations
Explain and be able to apply basic vector and raster spatial data structures including selecting a suitable data structure for geographic phenomena (level 1, 2 and 3).
Prior knowledge
Outgoing relations
- Line representation is a kind of Vector Representation
- Line representation is modelled by Node
Incoming relations
- Network is modelled by Line representation