Map distortion
Map distortions are changes in lengths, areas, angles and shapes that arise from the application of map projection.
Introduction
Distortion is the act of twisting or altering something out of its true, natural, or original state. The main problem in cartography is that it is not possible to map a spherical or ellipsoidal surface into a plane without distortions. A poorly chosen map projection can actually be harmful. We tend to believe what we see, and when fundamental geographical relationships, such as shapes, sizes, directions, and so on, are badly distorted, we are inclined to accept them as fact if we see them that way on maps. This can lead to very wrong impressions, for example, that the route from Chicago to Rome is due east or from San Francisco to Tokyo due west, or that North America is larger than Africa. Our mental maps, the brain’s geographical “data base,” are generated only from what we look at. Since globes are uncommon, most mental images of the Earth come from flat maps. A badly distorted map seen regularly (such as one on a television news program backdrop) will look familiar after a while and thus “look right.” This can cause one’s mental map of the world to become permanently warped. Since no map projection maintains correct scale throughout, it is important to determine the extent to which it varies on a map. On a world map, qualitative distortion is evident to an eye familiar with maps, after noting the extent to which landmasses are improperly sized or out of shape, and the extent to which meridians and parallels do not intersect at right angles or are not spaced uniformly along a given meridian or given parallel. On maps of countries or even of continents, distortion may not be evident to the eye, but it becomes apparent upon careful measurement and analysis (Snyder 1987).
Explanation
Leonhard Euler proved first in 1777 that there exists no map without distortion. All map projections involve distortion of areas, angles, and/or distances. The types of distortion can be controlled to preserve specific characteristics, but map projections must distort other characteristics of the object represented. The classical way of showing the distortion inherent in a projection is to use Tissot's indicatrix. Tissot (1881) described how to construct an ellipse that illustrates locally the amount and orientation of the components of distortion Tissot's indicatrix is often used to illustrate the variation of point scale across a map. Each function can be locally approximated by a linear function. Each map projection can be locally approximated by affine mapping. This was noticed by Tissot in the second half of the 19th century. By mapping a circle of an infinitesimal radius, an ellipse is obtained, which is called the distortion ellipse or Tissot's indicatrix. The directions of this ellipse are called the main directions and along them the local linear scale is the largest, and the smallest, respectively. A single indicatrix describes the distortion at a single point. Because distortion varies across a map, generally Tissot's indicatrices are placed across a map to illustrate the spatial change in distortion. A common scheme places them at each intersection of the displayed meridians and parallels. These schematics are important in the study of map projections, both to illustrate distortion and to provide the basis for the calculations that represent the magnitude of distortion precisely at each point. Let a be the maximal value, and b the minimal value of the local linear scale factor. These are semiaxes of the Tissot's indicatrix. If a = b = 1, we have a standard point. If a = 1 or b = 1, we have an equidistant point. The expression a = b = 1 cannot be true at all points of a two-dimensional area on the map, because this would mean a map projection without distortion, which is impossible. In conformal maps, where each point preserves angles projected from the geometric model, the Tissot's indicatrices are all circles of size varying by location, possibly also with varying orientation (given the four circle quadrants split by meridians and parallels). In equal-area projections, where area proportions between objects are conserved, the Tissot's indicatrices all have the same area, though their shapes and orientations vary with location. In arbitrary projections, both area and shape vary across the map. In the 1970s G. I. Konusova proposed a local criterion. This criterion is an angular value. Let us call it the classification angle. The classification angle α is calculated as follows:
Let us consider this formula in more detail. In conformal projections at any point on the map, the partial length scale does not depend on the direction, a = b, and therefore. In equal area projections, the partial area scale p = ab = 1, therefore,
. In equidistant projections, the effects of distortions of shapes (angles) and areas are the same; in the formula the numerator is equal to the denominator,
. Therefore, a quantitative assessment of the division of projections according to the nature of distortions into separate steps based on the value of the classification angle a is carried out as follows:
— conformal projections
— equidistant projections
— equal-area projections In order to compare map projections with respect to their distortion characteristics, it is appropriate to quantify overall distortion by one single measure. To develop a strategy to minimise the distortion of large areas, one first had to define a measure that is able to quantify the overall distortion of large areas properly. This is not as simple as it may seem. Tissot (1881) proposed to characterise the distortion of a map projection by the maximum value attained over the mapped area. Maximum distortion values can be calculated but they have one major disadvantage. They do not consider how distortion is spatially distributed. To consider the spatial variation of distortion, the local measures can be integrated over the region of interest. The criteria of Jordan, Airy, Airy-Kavrayskiy and others are known. It is important to note that all distortions can be eliminated if we know the map projection in which the map was made. Cartographers usually want to create a map with as few distortions as possible. However, in some cases the approach is reversed. A cartogram (also called a value-area map or an anamorphic map) is a thematic map of a set of features (countries, provinces, etc.), in which their geographic size is altered to be directly proportional to a selected ratio-level variable, such as travel time, population, or GNP. Geographic space itself is thus warped, sometimes extremely, in order to visualize the distribution of the variable.
Examples
The use of a familiar shape to visualize distortion is the simplest and often the most engaging of methods for symbolizing distortion. A face or regular shape is created on a base map and then transformed. The human head or face is a popular theme. Such illustrations give an idea at a glance of the exaggerations and distortions of some projections. Figures 1-5 show a human face in different map projections. They illustrate distortions inherent in map projections.
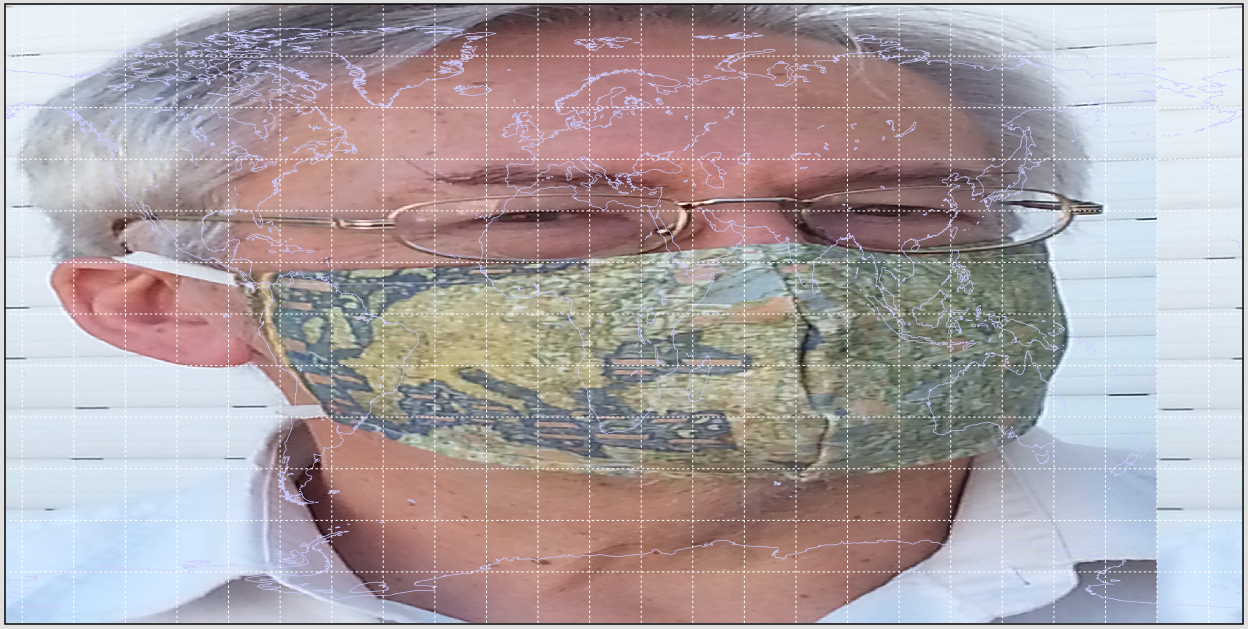
Figure 1: Human face in the Equirectangular Projection
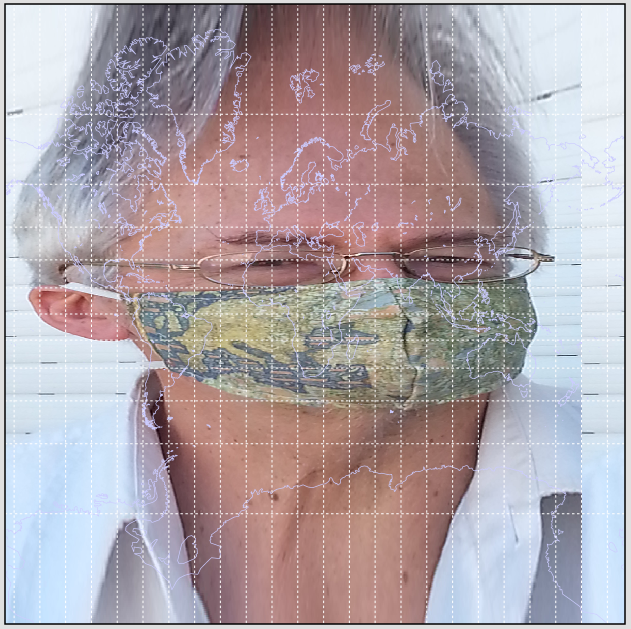
Figure 2: Human face in the Mercator Projection
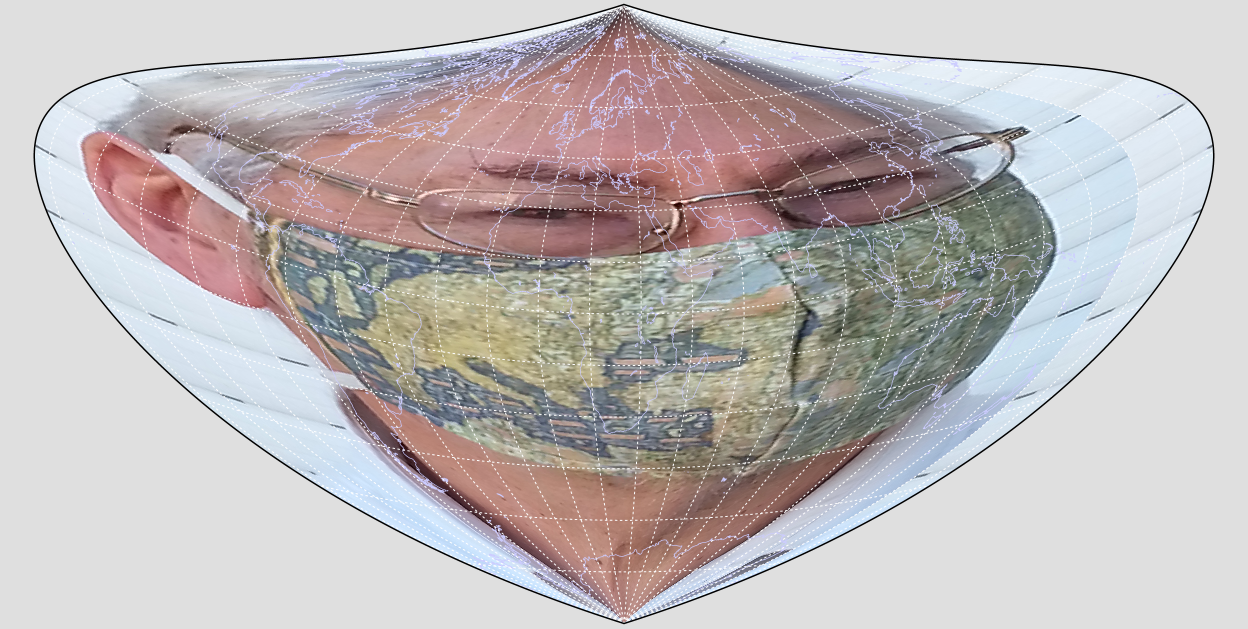
Figure 3: Human face in the Bonne Projection
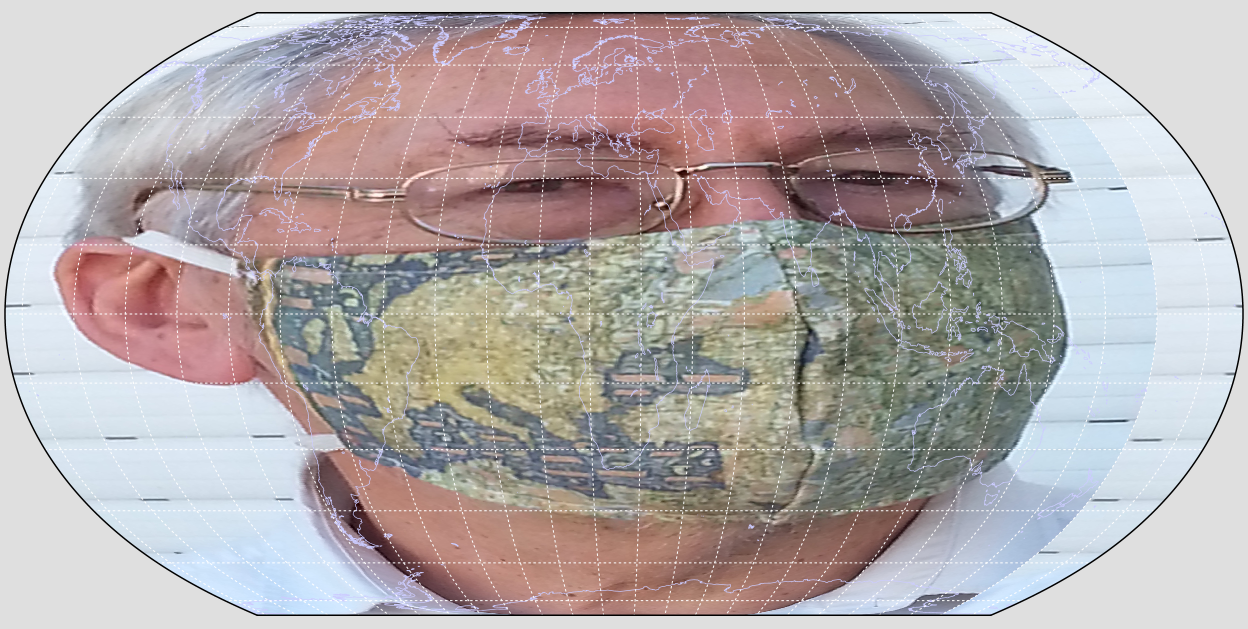
Figure 4: Human face in the Equal Earth Projection
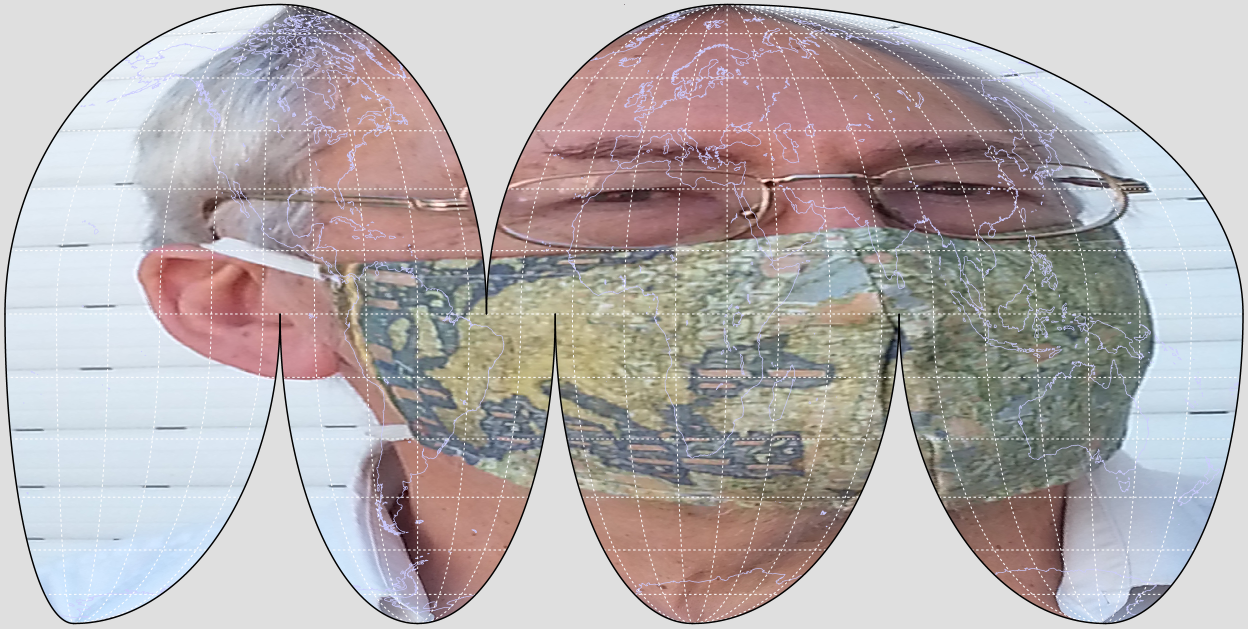
Figure 5: Human face in the Mollweide Interrupted Projection
How to
A map distorts distances (linear distortion) wherever the local linear scale factor deviates from 1. Unless the projection is conformal at the point being considered, the scale factor varies by direction around the point. A map distorts angles wherever the angles measured on the surface to be mapped are not conserved in the projection. This is expressed by an ellipse of distortion which is not a circle. A map distorts areas wherever areas measured on the surface to be mapped are not conserved in the projection. This is expressed by ellipses of distortion whose areas vary across the map.
Synonyms
Map deformation
External resources
- Euler L (1777) De Repraesentatione Superficiei Sphaericae Super Plano; Academia Scientiarum Imperialis Petropolitanae: St. Petersburg, Russia, 1777; pp. 107–132, Latin. Translated into German as one of Drei Abhandlungen über Kartenprojection, in Ostwald’s Klassiker der Exakten Wissenschaften, no. 93: Leipzig,Wilhelm Engelmann, 1898, with editing by Albert Wangerin, pp. 3–37
- Professional Paper 1395; USGS Publications: Washington DC, USA
- Snyder J P (1987) Map Projections − A Working Manual; U.S. Geological Survey Professional Paper 1395; USGS Publications: Washington DC, USA
- Tissot N A (1881) Mémoire sur la représentation des surfaces et les projections des cartes géographiques: Paris, Gauthier Villars, 337 p. +60 p. tables.
Learning outcomes
-
10 - Learning outcomes - Map distortion
Awareness of the necessity of distortion on any map. Understanding distortion of distances, area, and angles. Ability to recognize the local properties of the map projection based on Tissot's indicatrix. Insight into the possibility of removing all distortions from the map if one knows the map projection in which the map was made.
Prior knowledge
Outgoing relations
- Map distortion is part of Map projections
Contributors
-
Miljenko Lapaine
Professor emeritus at Faculty of Geodesy, University of Zagreb
https://www.geof.unizg.hr/en/djelatnici/miljenko-lapaine/