9 - Data entry: data input techniques
Describe and explain standard spatial (and non-spatial) data input techniques (non RS) including the management of the data collection process (level 1 and 2).
Concepts
-
Spatial Data Collection
Spatial data can be obtained from various sources. It can be collected from scratch, using direct spatial-data acquisition techniques, or indirectly, by making use of existing spatial data collected by others. The first source could include field survey data and remotely sensed images. To the second source belong printed maps and existing digital data sets.
-
Digitizing
A traditional method of obtaining spatial data is through digitizing existing printed maps. This can be done using on-tablet and on-screen manual digitizing. Before adopting this approach, one must be aware that positional errors already on the map will further accumulate and that one must be willing to accept these errors.
-
Field survey
Field surveys of natural and water resources are frequently carried out to check and supplement information derived from the interpretation of aerial photographs and satellite imagery (Figure below). Often, sample areas are chosen within a study area for more detailed investigations. Socio-economic data, however, are often collected on the basis of administrative districts, with the result that their location is insufficiently precise to permit analysis of high quality.

Figure: Field workers checking and collecting supplementary information in the field. -
Terrestrial survey
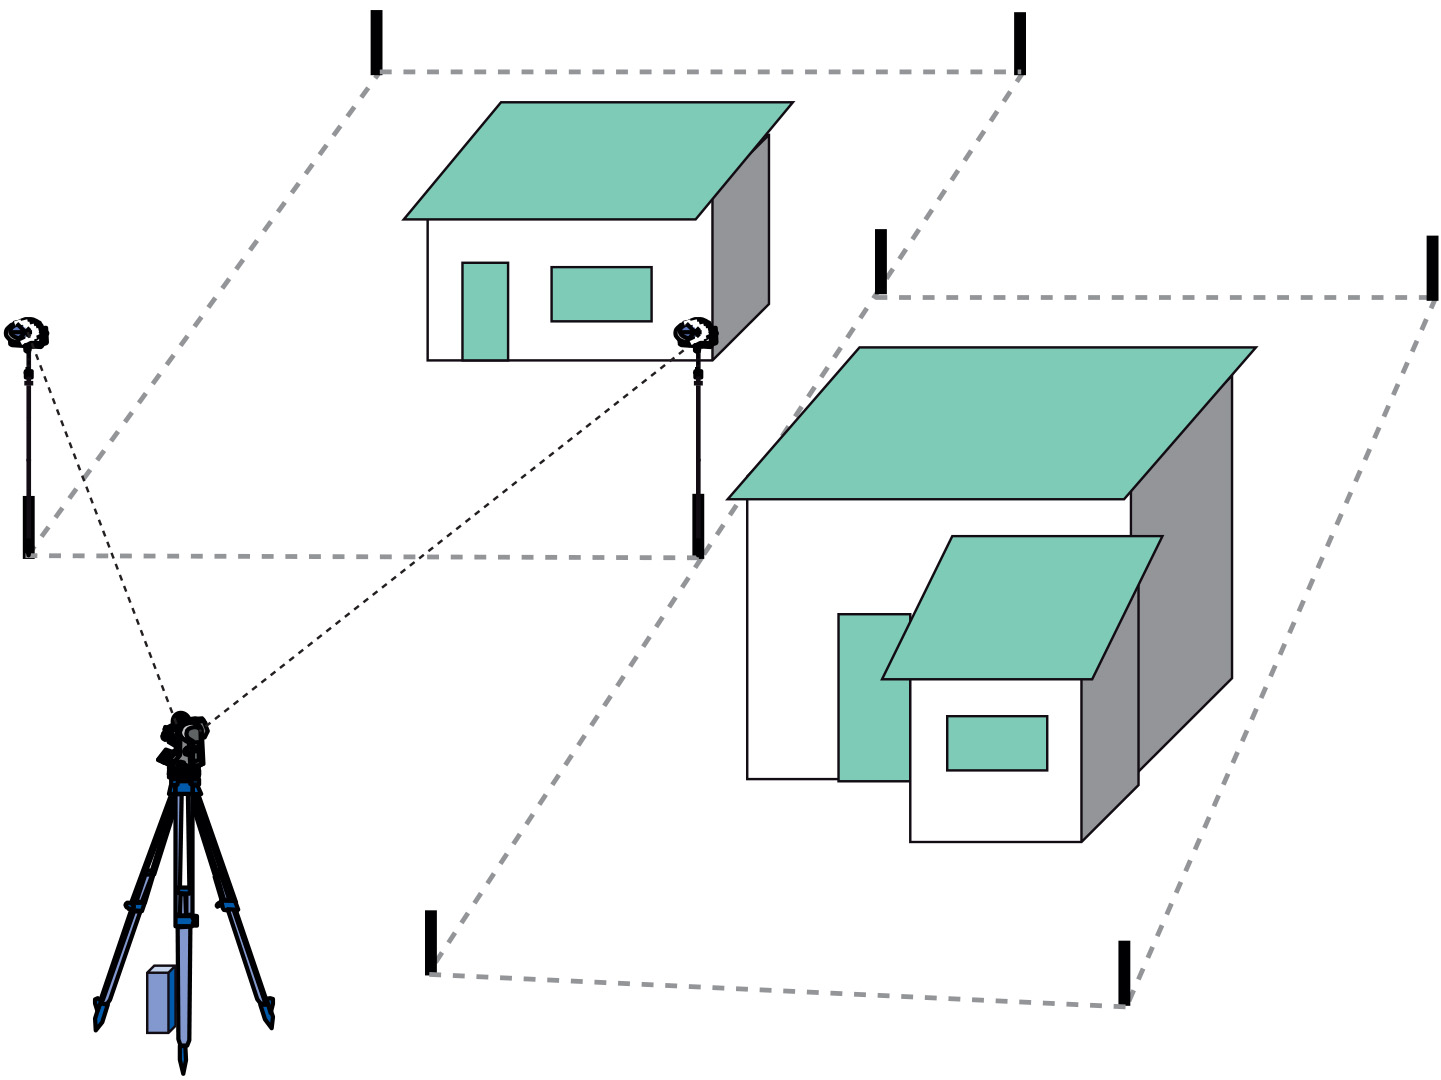
Terrestrial surveys are usually employed for details that must be measured accurately, e.g. survey control stations, property boundaries, buildings, and road construction works (Figure below). The surveyed data are often used to supplement and update existing data and for verification of data collected from aerial surveys and by satellite remote sensing. A terrestrial survey records features showing their relative position both horizontally and vertically. Several surveying techniques are employed to do this.

Terrestrial surveys are used to map details such as property boundaries. -
Mobile Sensor
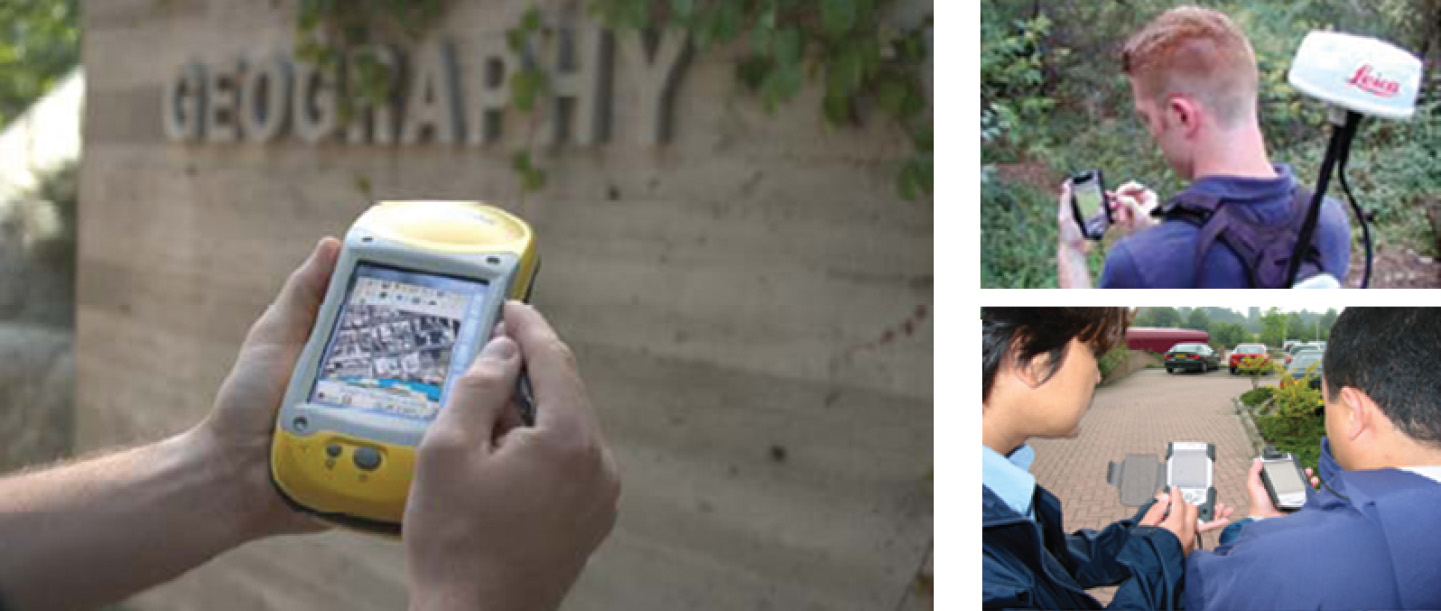
Until recently, printed maps and forms were taken to the field and the information collected was sketched as notes on the map or written down on a form. This information was entered into a GIS database after returning to the office. This method of data collection is inefficient and prone to error. With a mobile Sensors system and the support of a satellite receiver, we can take a
GIS into the field with us on powerful, compact mobile computers and view, capture and update information, and then synchronize changes between the field and office (Figure 1).
Figure 1: Mobile GIS provides the integration of mapping, GIS and positioning to field users via hand-held and mobile devices -
Aerial survey
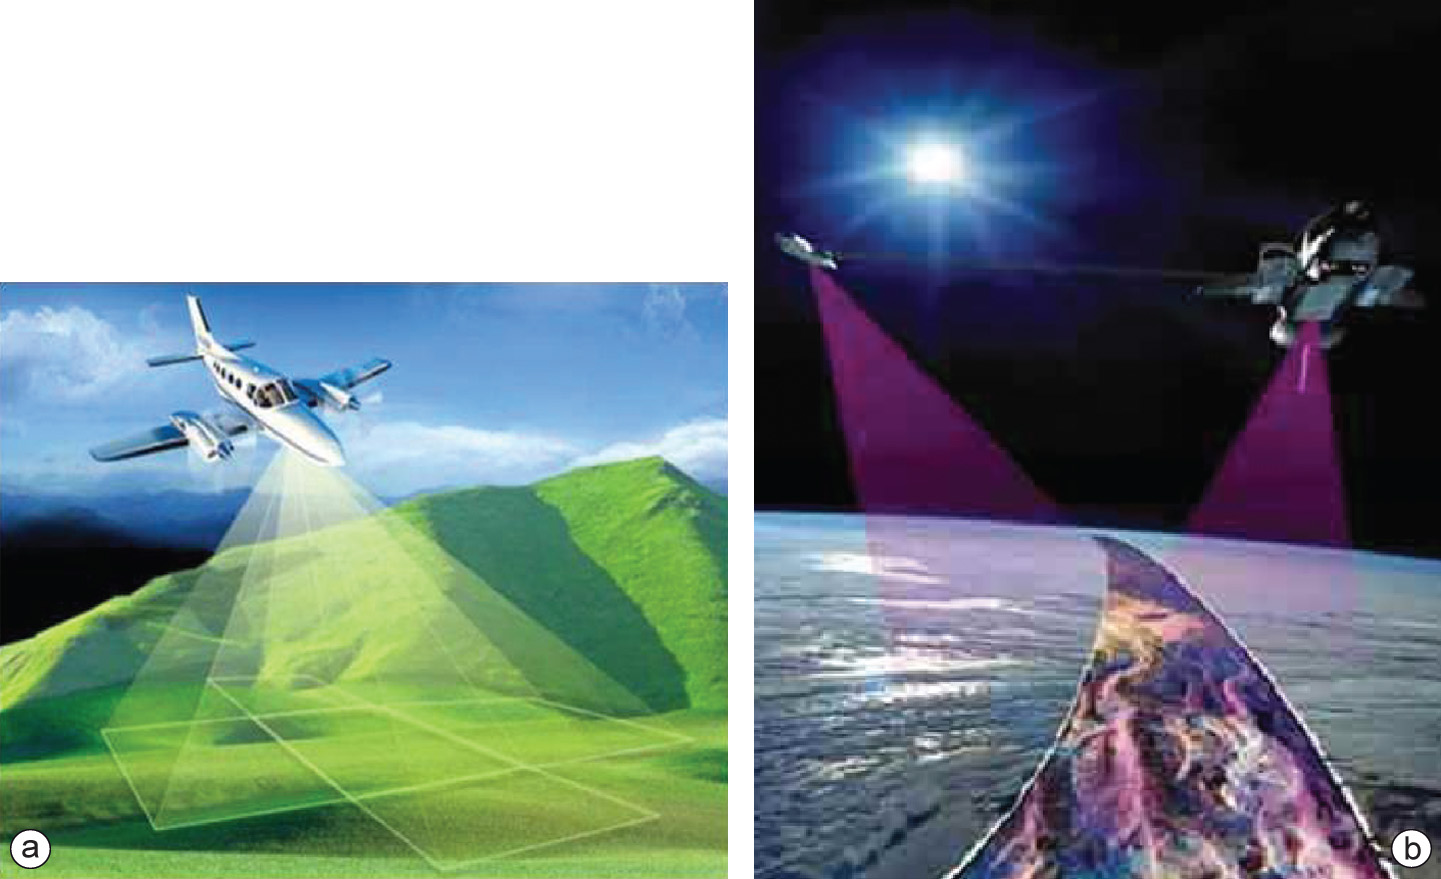
Aerial photographs are a major source of digital data; soft-copy workstations are used to digitize features directly from stereo pairs of digital photographs. These systems allow data to be captured in two or three dimensions, with elevations measured directly from a stereo pair using the principles of photogrammetry. Analogue aerial photos are often scanned before being entered into a soft-copy system, but with the advance of high-quality digital cameras this step can now be skipped.
In general, the alignment of roads and railways, lakes and water, and shapes of buildings are easily interpreted on aerial photographs - assuming that the scale of the photographs is not too small. Also, constructions such as dikes, bridges, air fields and the main types of vegetation and cultivation are mostly clearly visible. Nevertheless, numerous attribute data related to terrain features cannot be interpreted on aerial photographs: e.g. the administrative qualification of roads, sea and lake depths, functions of buildings, street names, and administrative boundaries. We will have to collect this information in the field or from existing data sets and maps (e.g. road maps, navigational charts or town plans).

Figure: Aerial surveys (a) and satellite remote sensing (b) are employed to map relatively large areas at comparably large scales, source : Shuttle Radar Topography Mission, U.S. Geological Survey Department of the Interior/USGS and NASA, JPL.