Map design
Introduction
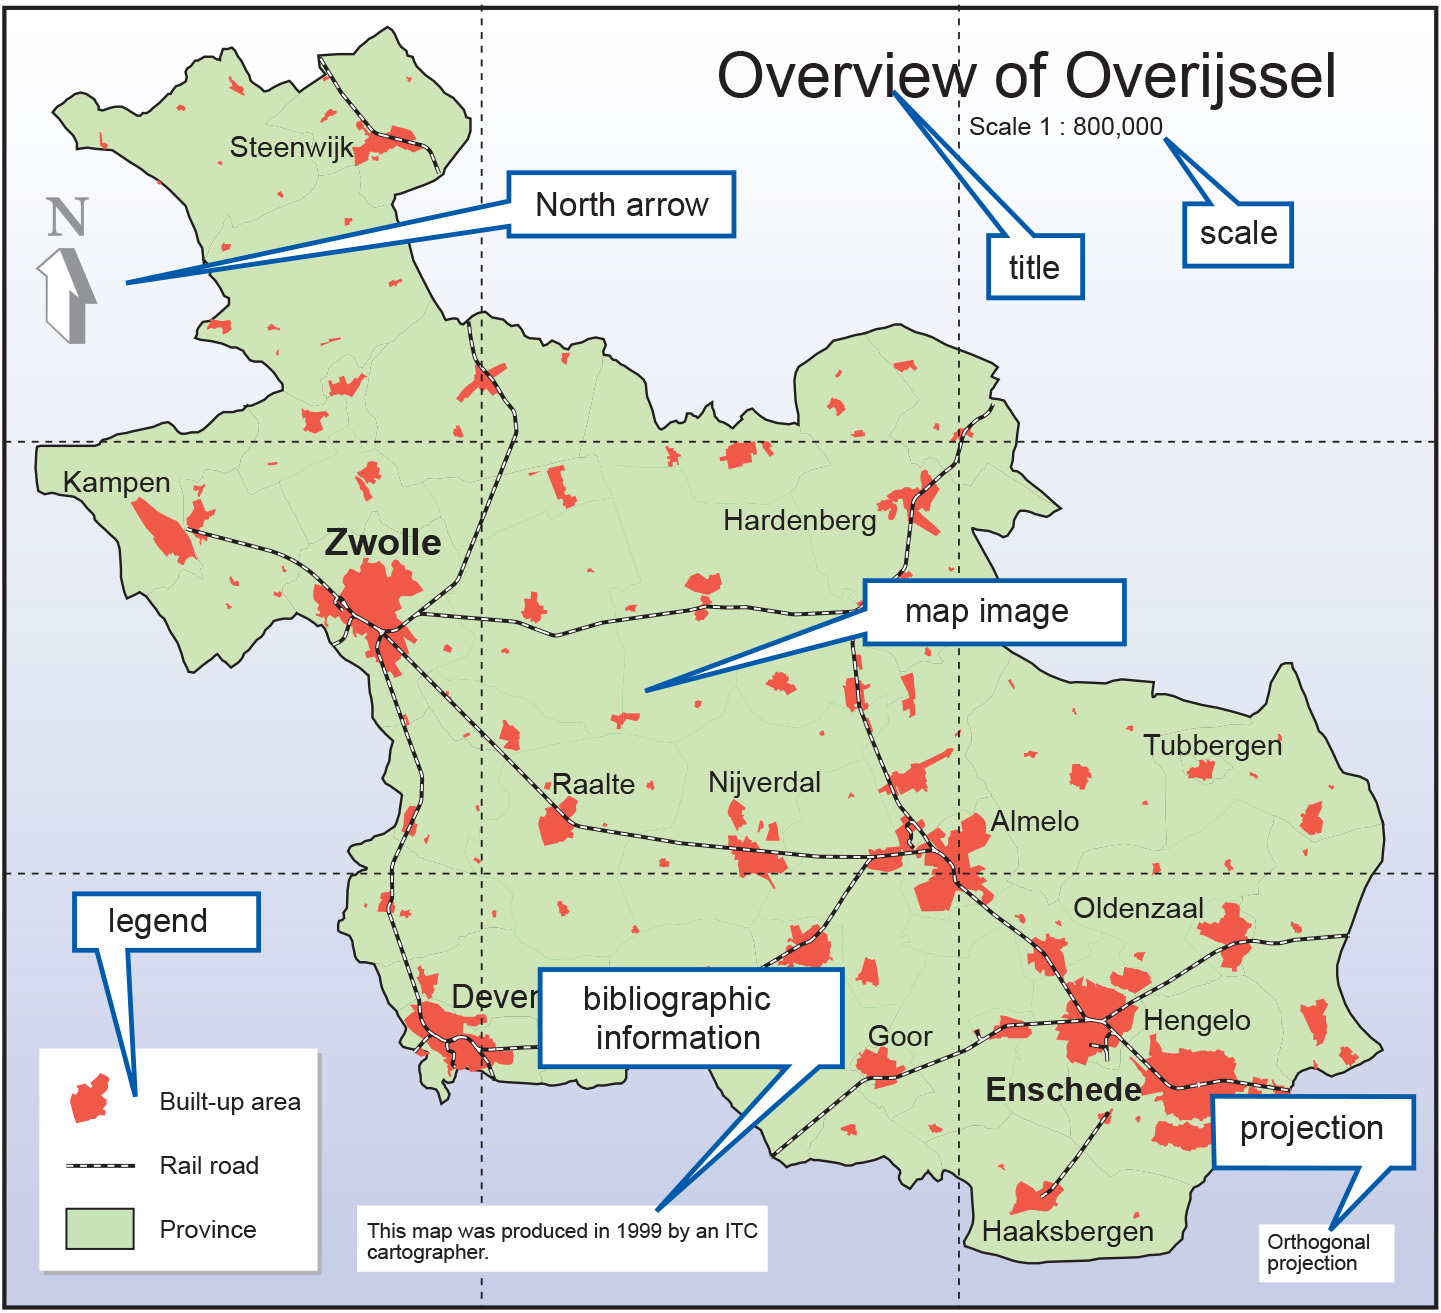
Each map should have, next to the map image, a title to inform the user of the topic visualized. A legend is necessary to understand how the topic is depicted. Additional marginal information to be found on a map is a scale indicator, a North arrow for orientation, the map datum and map projection used, and some lineage information, (such as data sources, dates of data collection and methods used). Furthermore, information can be added that indicates when the map was issued and by whom (author/publisher).
Explanation
All this information allows the user to obtain an impression of the quality of the map and is comparable with meta-data describing the contents of a database or data layer. Figure 1 illustrates these map elements. On printed maps, these elements (if all are relevant) have to appear next to the map face itself. Maps presented on screen often do without marginal information, partly because of space constraints. However, on-screen maps are often interactive and clicking on a map element may reveal additional information from the database. Legends and titles are often also available on demand.
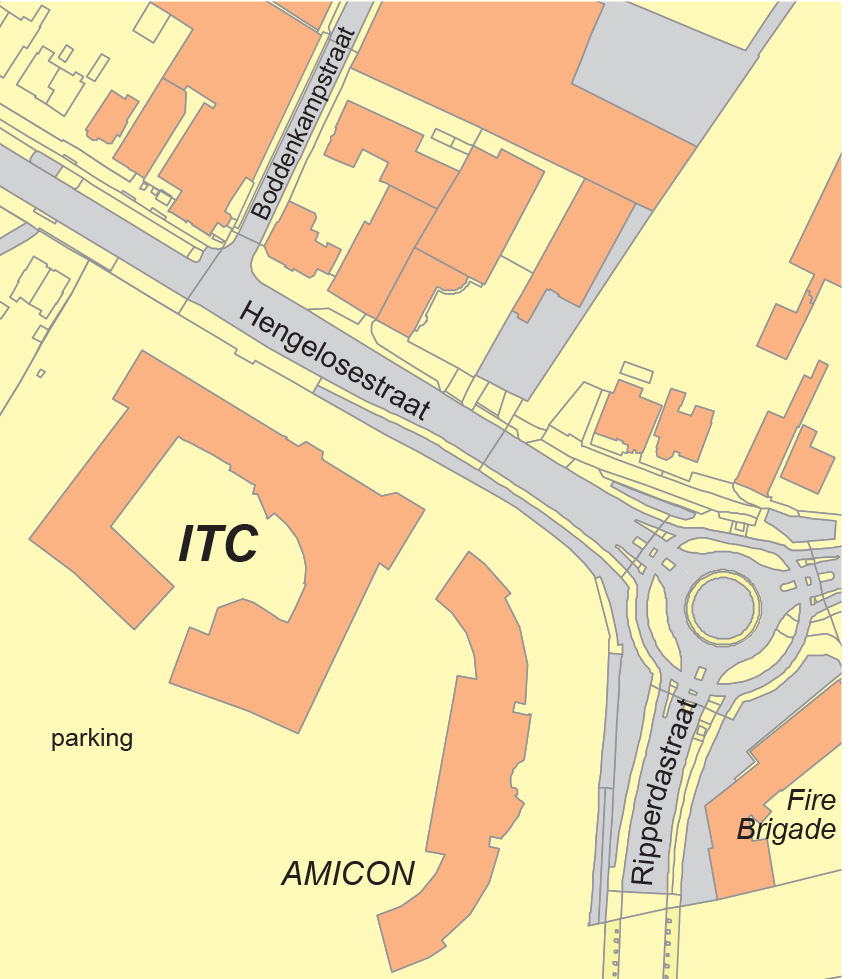
The map in Figure 1 is one of the first in this section that has text included. Figure 2 is another example. Text is used to transfer information in addition to that through the symbols used. This can be done by the applying visual elements to the text as well, as in Figure 2: italics—is a case of the visual variable orientation—have been used for building names to distinguish them from road names. Another common example is the use of colour to differentiate (at a nominal level) between hydrographic names (in blue) and other names (in black). The text should also be placed in a proper position with respect to the object to which it refers.
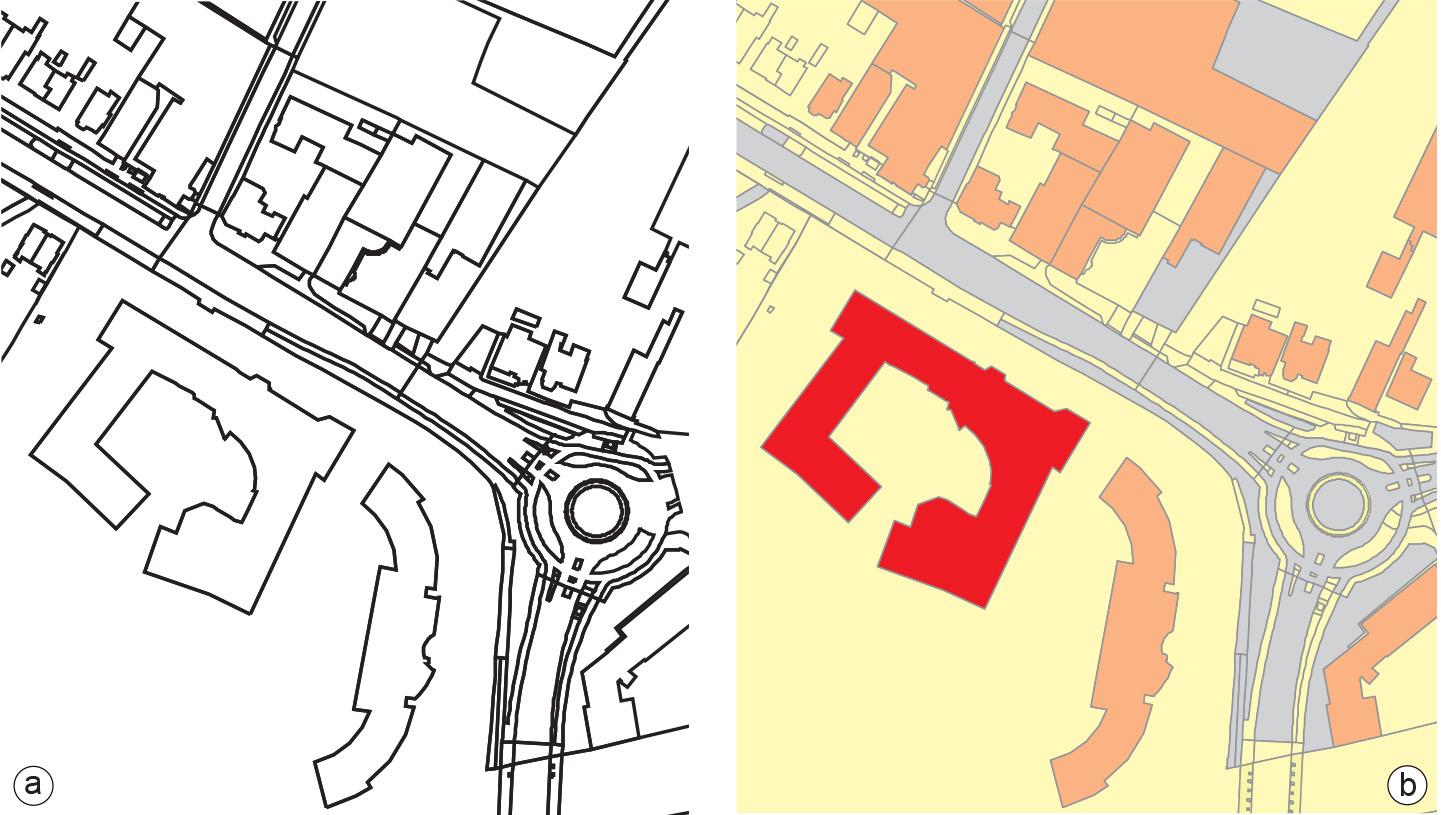
Maps constructed according to basic cartographic guidelines are not necessarily visually appealing maps. Although well-constructed, they might still look sterile. The design aspect of creating appealing maps also has to be included in the visualization process. “Appealing” does not only mean having nice colours. One of the keywords here is contrast. Contrast will increase the communication role of the map since it creates a hierarchy in the map contents, assuming that not all information is of equal importance. This design trick is known as visual hierarchy or the figure–ground concept. The need for visual hierarchy in a map is best understood by looking at the map in Figure 3a, which just shows lines. The map of the ITC building and surroundings in part (b) is an example of a map that has visual hierarchy applied. The first object to be noted will be the ITC building (the darkest patch in the map) followed by other buildings, with the road on a lower level and the urban land parcels at the lowest level.
Outgoing relations
- Map design is based on Cartographic communication
- Map design is based on Data characteristics in mapping
- Map design is based on Dissemination
- Map design is based on Map purpose
Incoming relations
- Map is based on Map design