Scales of processes and observations
Introduction
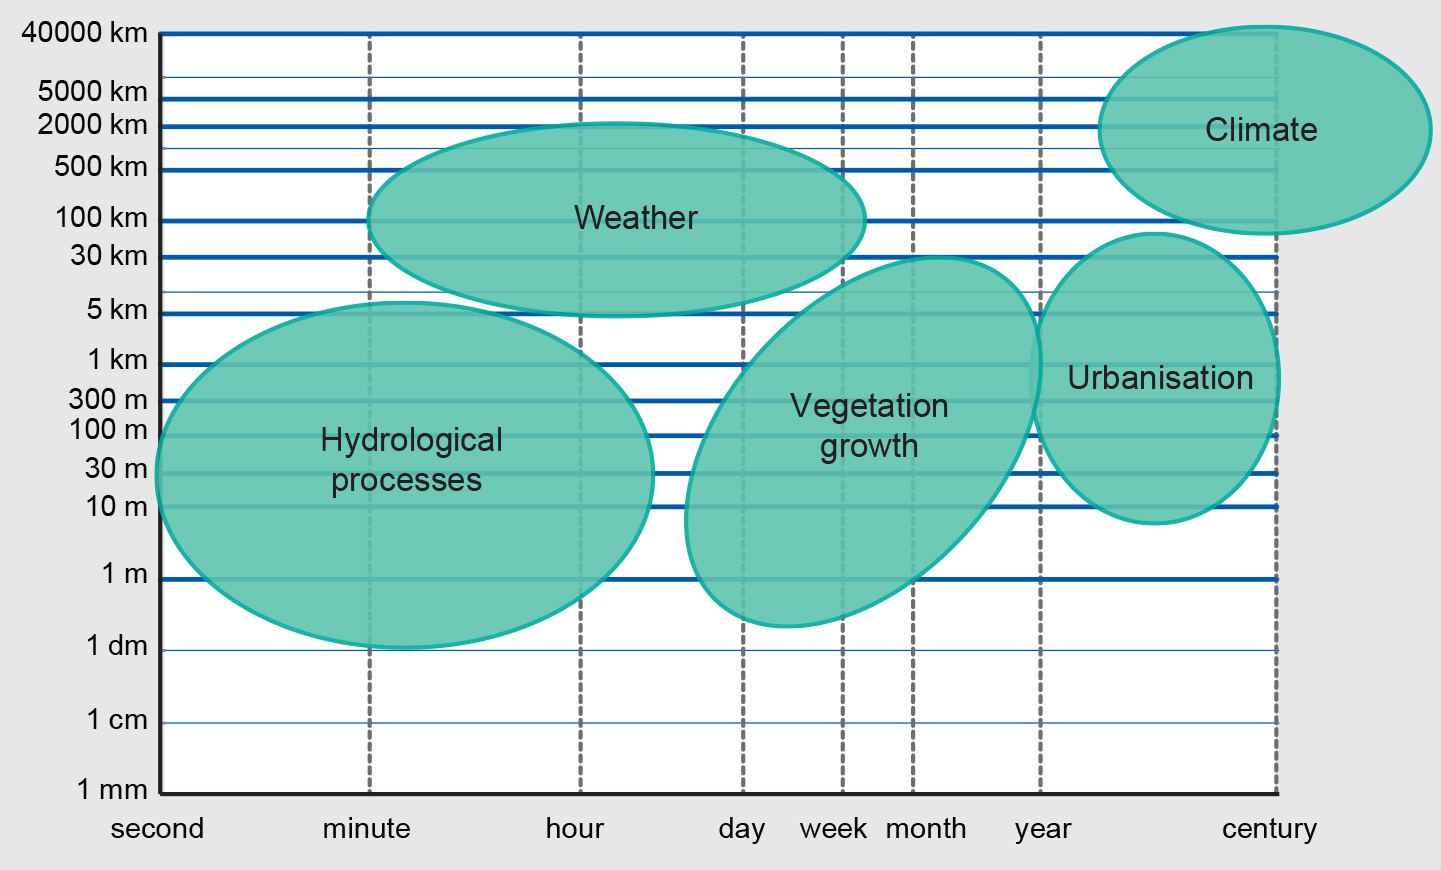
Scales are more applicable to processes in the spatial and temporal domains than to those in the spectral domain. For a number of important Earth system processes, their corresponding scales are roughly indicated in Figure 1, which has logarithmic X- and Y-axes in order to accommodate the large ranges to be considered in the spatial and temporal domains. In the spatial domain this goes from 1 mm to 40,000 km (the circumference of the Earth), and in the temporal domain from one second to a century.
Spatial and temporal scales can not only be attached to processes, but also to observations. An example is given in Table 1, which summarizes the spatial and temporal scales of a few well-known Earth observation systems.
| Sensor | Spatial scale | Temporal scale |
|---|---|---|
| Meteosat | Hemisphere | 15 minutes |
| NOAA-AVHRR | 3000 km | daily |
| Landsat TM | 180 km | 16 days |
| Spot | 60 km | 26 days (pointable) |
Outgoing relations
- Scales of processes and observations is related to Resolution
Incoming relations
- Data measurement scale is related to Scales of processes and observations
- Levels of spatial aggregation is related to Scales of processes and observations