Process model
Introduction
Process models in the Earth sciences describe the evolution of geo(bio)physical surface properties in time, independently from remote sensing observations. Examples of such process models on various time scales are, for instance, numerical weather prediction models (NWPs), vegetation growth models, hydrological models, oceanographic models and climate models.
Explanation
Process models in the geosciences usually rely on regular observations at many locations spread over a large area. Traditionally, these observations were mostly made in the field with a variety of instruments. Remote sensing techniques have tremendously increased the capability of spatial sampling and the consistency of the surface parameters measured. RS instruments are mostly sensitive to many physical properties of the surface, some of these may not belong to the set of properties that the user is interested in. Exceptions to this are the mapping of sea-surface temperature, laser altimetry and gravimetry, which are measurements of direct geophysical interest. In the majority of cases, however, there are only indirect relationships between what is observed with the instrument and the physical object properties of interest. In these cases, the use of observation models becomes an attractive option, since these models describe the relationships between all object properties relevant for the observation and the observed remote sensing data.
Examples
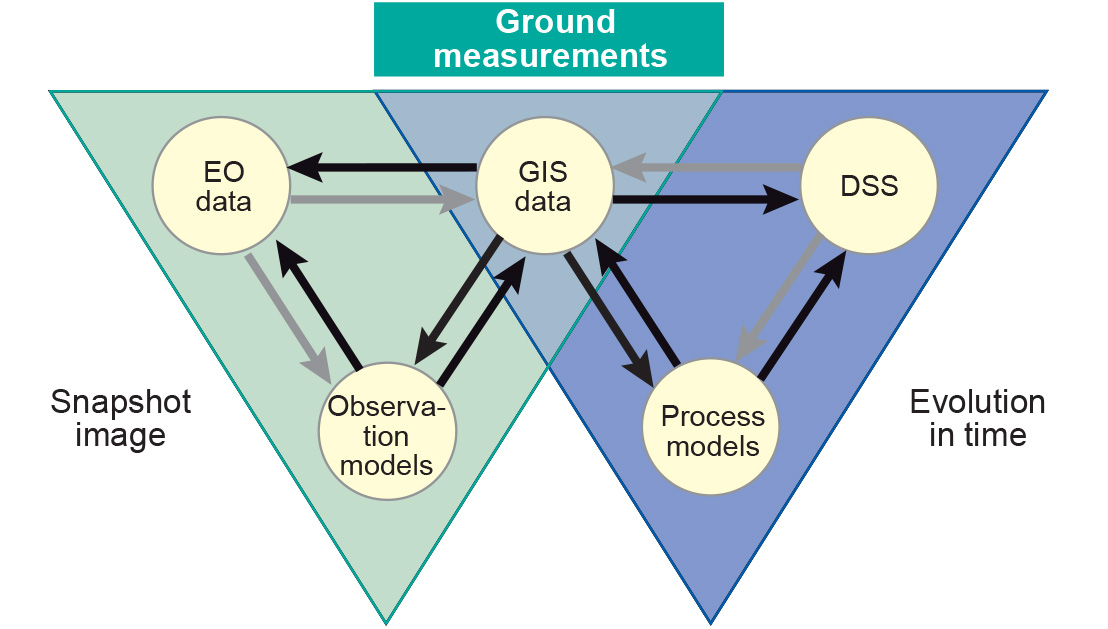
Observation models and process models can supplement each other to enhance the quality of the interpretation of remote sensing data and to fill gaps in time that occur when observations are not possible owing to clouds or some other cause. Figure 1. shows possible interactions of observation models and process models with EO data and existing geographic information (GIS and ground measurements, supplemented with decision-support systems (DSSs)). A central role is played by the GIS database, which provides a common geographic reference. The diagram shows how Earth observation data provide a series of snapshots of the situation on the Earth’s surface (green triangle) and how this monitoring of the surface feeds a process model that is updated with actual data (purple triangle). The process model provides information to the decision-support system, which supports management actions aimed at controlling/mitigating the process. A good example of this is a water management system, in which one might decide to allocate water for irrigation if the observed vegetation appears to suffer from drought stress.
Outgoing relations
- Process model is a kind of Model
- Process model is based on Observation
Incoming relations
- Data assimilation is used by Process model