Irregular Tessellation
Introduction
Irregular Tessellations are partitions of space into mutually distinct cells, but now the cells may vary in size and shape, allowing them to adapt to the spatial phenomena that they represent. Irregular tessellations are more complex than regular ones, but they are also more adaptive, which typically leads to a reduction in the amount of computer memory needed to store the data.
Regular tessellations provide simple structures with straightforward algorithms that are, however, not adaptive to the phenomena they represent. This means they might not represent the phenomena in the most efficient way. For this reason, substantial research effort has been put into irregular tessellation.
Explanation
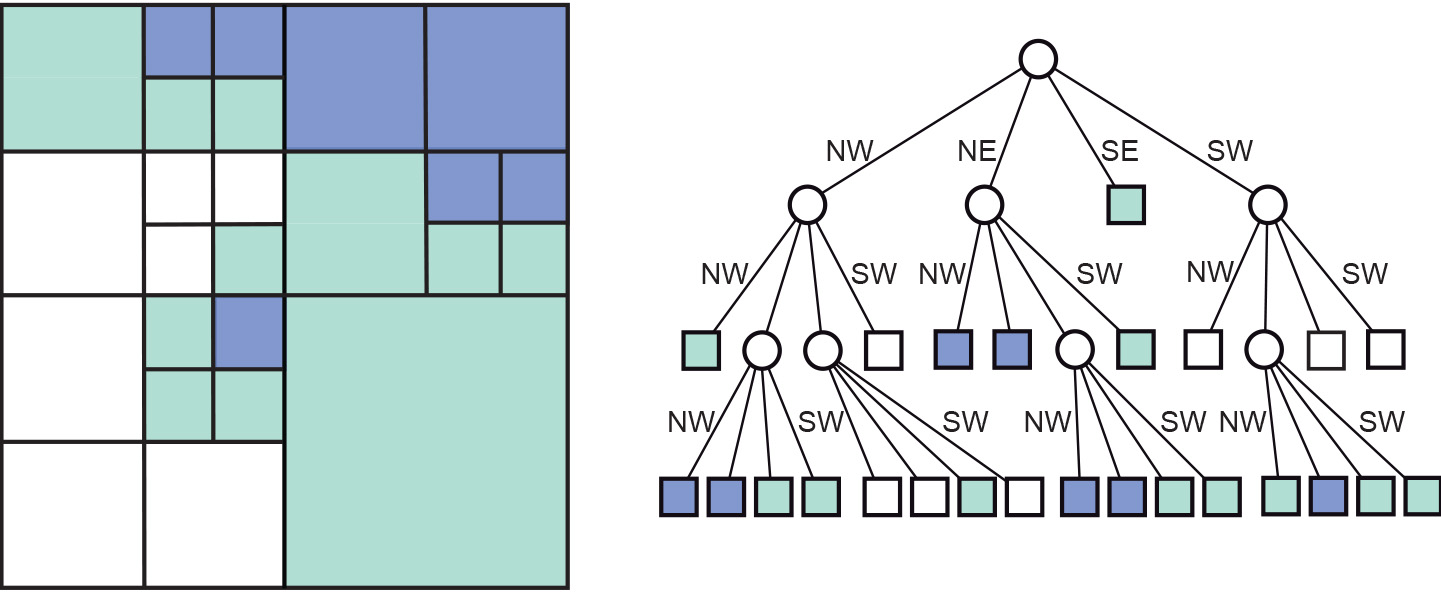
A well-known data structure in this family - upon which many more variations have been based - is the region quadtree. It is based on a regular tessellation of square cells, but takes advantage of cases where neighbouring cells have the same field value, so that they can be represented together as one bigger cell. A simple illustration is provided in the Figure above. It shows a small 8×8 raster with three possible field values: white, green and blue. The quadtree that represents this raster is constructed by repeatedly splitting up the area into four quadrants, which are called NW, NE, SE, SW for obvious reasons. This procedure stops when all the cells in a quadrant have the same field value. The procedure produces an upside-down, tree-like structure, hence the name “quadtree”. In the computer’s main memory, the nodes of a quadtree (both circles and squares in the Figure) are represented as records. The links between them are pointers, i.e. a programming technique to address (or to point to) other records. Quadtrees are adaptive because they apply Tobler’s law. When a conglomerate of cells has the same value, they are represented together in the quadtree, provided their boundaries coincide with the predefined quadrant boundaries. Therefore, a quadtree provides a nested tessellation: quadrants are only split if they have two or more different values.
Learning outcomes
-
2 - Spatial data modelling: computer representations
Explain and be able to apply basic vector and raster spatial data structures including selecting a suitable data structure for geographic phenomena (level 1, 2 and 3).
Prior knowledge
Outgoing relations
- Irregular Tessellation is a kind of Tessellation