Final interpretation
Introduction
Final Interpretation
The final interpretation is the interpretation of the entire area in terms of what is on the ground, resulting from the correlation of the fieldwork data and the preliminary interpretation.
Quality aspects of image interpretion.
The quality of the result of image interpretation depends on three factors: the interpreter,
the images used, and the guidelines provided.
- Professional experience, particularly experience with image interpretation, determines the skill of a photo-interpreter. A professional background is required: a geological interpretation, for example, can only be made by a geologist, since trained interpreter they are best able to related image features to geological phenomena. Local knowledge, derived by field visits, is needed to facilitate interpretation.
- The images used limit the phenomena that can be studied, both in a thematic and geometric sense. One cannot, for example, generate a reliable database on tertiary road systems using data from low resolution multispectral scanners. On adequate images the other hand, B&W aerial photos contain limited information about agricultural crops.
- The quality of the interpretation guidelines has a great deal of influence. Consider,for example, a project in which a group of persons is to carry out a mapping project. Ambiguous guidelines will prevent consistent mapping, for which clear guidelines a seamless database of consistent quality is required, despite individual input.
Especially in large projects and monitoring programmes, all three points just listed
play an important role in ensuring the replicability of the work. Replicability refers
to the degree of correspondence of results obtained by different persons for the same
area or by the same person for the same area at different times. Replicability does
replicability not provide information on the accuracy (the relation with the real world) but it does give an indication of the quality of the class definition (crisp or ambiguous) and the
instructions and methods used.
Examples
Figure A and Figure B provide two examples of how this works. Figure A gives two interpretation results for the same area.
Note that both results differ in terms of the total number of objects (map units) and in terms
of (line) generalization.
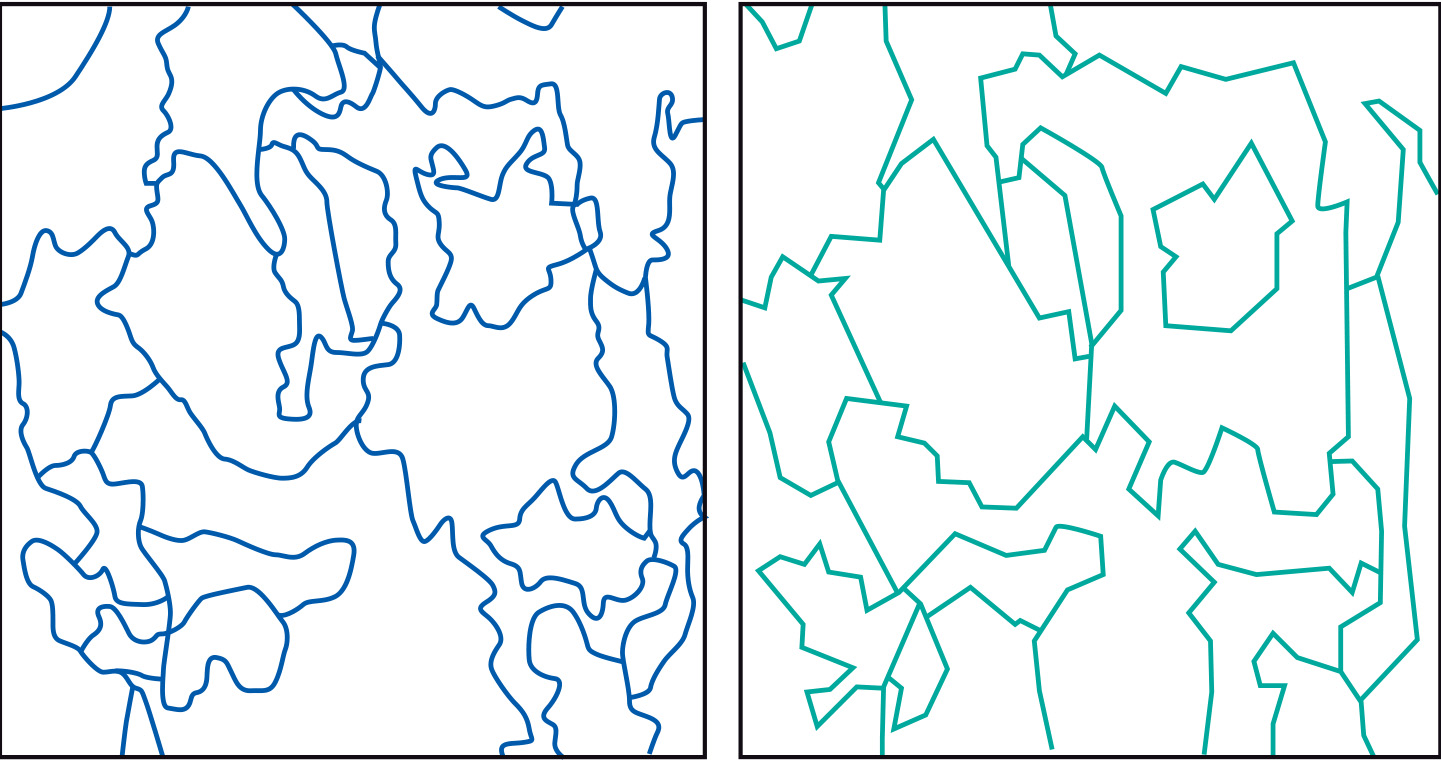
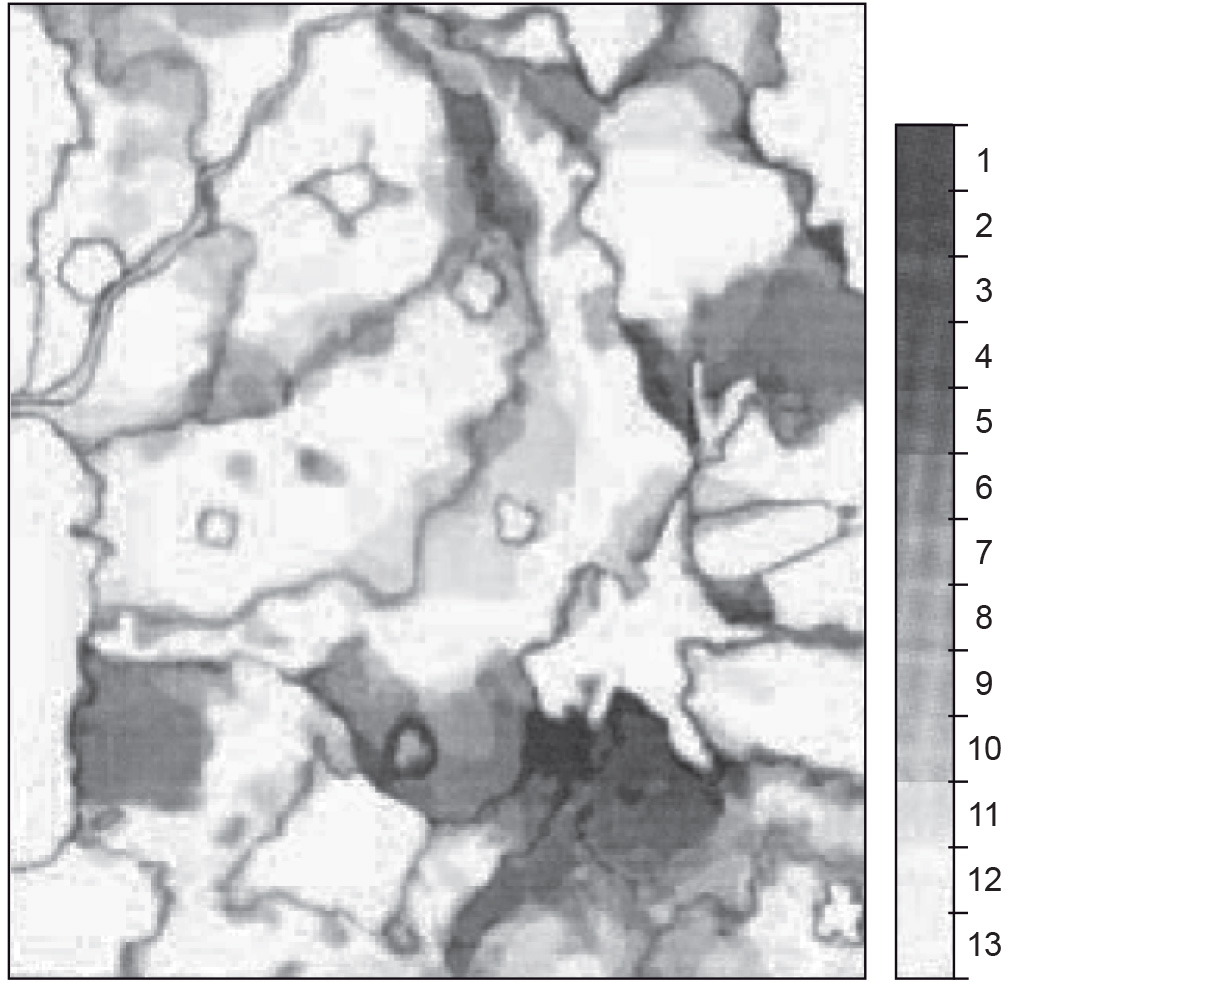
Figure B. compares 13 individual geomorphological interpretations. Similarly to Figure A, large differences occur along the boundaries. In addition to this, you could also conclude that for some objects (map units) there was no agreement on the thematic attribute.
External resources
- Middelkoop, H. (1990). Uncertainty in a GIS, a test for quantifying interpretation output. ITC Journal, 1990(3), 225–232.
Outgoing relations
- Final interpretation is a kind of Visual image interpretation
- Final interpretation is based on Correlation
- Final interpretation is part of Mapping procedure