Classification Algorithm
Introduction
After the training sample sets have been defined, classification of the image can be carried out by applying a classification algorithm. Several classification algorithms exist. The choice of the algorithm depends on the purpose of the classification and the characteristics of the image and training data. The operator needs to decide if a reject or unknown class is allowed. In the following, three classifier algorithms are described. First the box classifier is explained—its simplicity helps in understanding the principle. In practice, the box classifier is hardly ever used, however; minimum distance to mean and the maximum likelihood classifiers are most frequently used.
Explanation
Box classifier
The box classifier is the simplest classification method (Figure 1). For this purpose, upper and lower limits are defined for each band and each class. The limits may be based on the minimum and maximum values or on the mean and standard deviation per class. When the lower and the upper limits are used, they define a box-like area in the feature space. The number of boxes depends on the number of classes. During classification, every feature vector of an input (two-band) image will be checked to see if it falls in any of the boxes. If so, the cell will get the class label of the box it belongs to. Cells that do not fall inside any of the boxes will be assigned the “unknown class”, sometimes also referred to as the “reject class”.
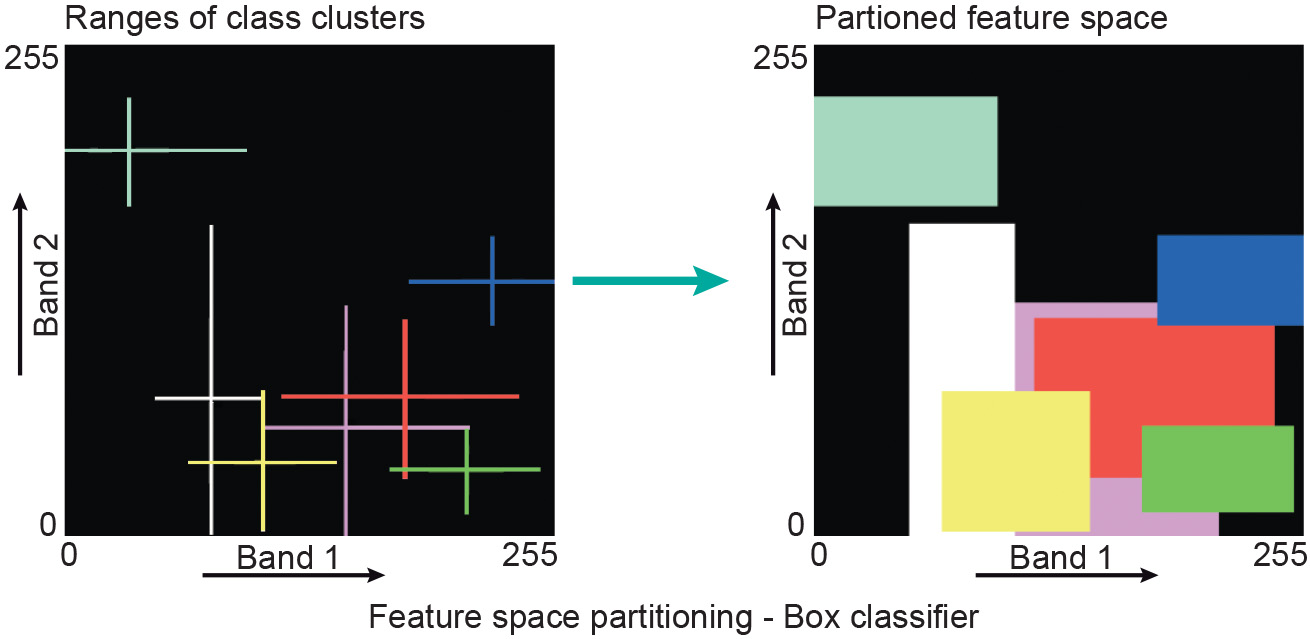
Principle of the box classification in a two-dimensional situation.
The disadvantage of the box classifier is the overlap between classes. In such a case, a cell is arbitrarily assigned the label of the first box it encounters.
Minimum Distance to Mean classifier
The basis for the minimum distance to mean (MDM) classifier is the cluster centres. During classification, the Euclidean distances from a candidate feature vector to all the cluster centres are calculated. The candidate cell is assigned to the class that qualifies as the closest one. Figure 2 illustrates how a feature space is partitioned based on the cluster centres. One of the disadvantages of the MDM classifier is that points that are at a large distance from a cluster centre may still be assigned to this centre. This problem can be overcome by defining a threshold value that limits the search distance. Figure 2 illustrates the effect; the threshold distance to the centre is shown as a circle.
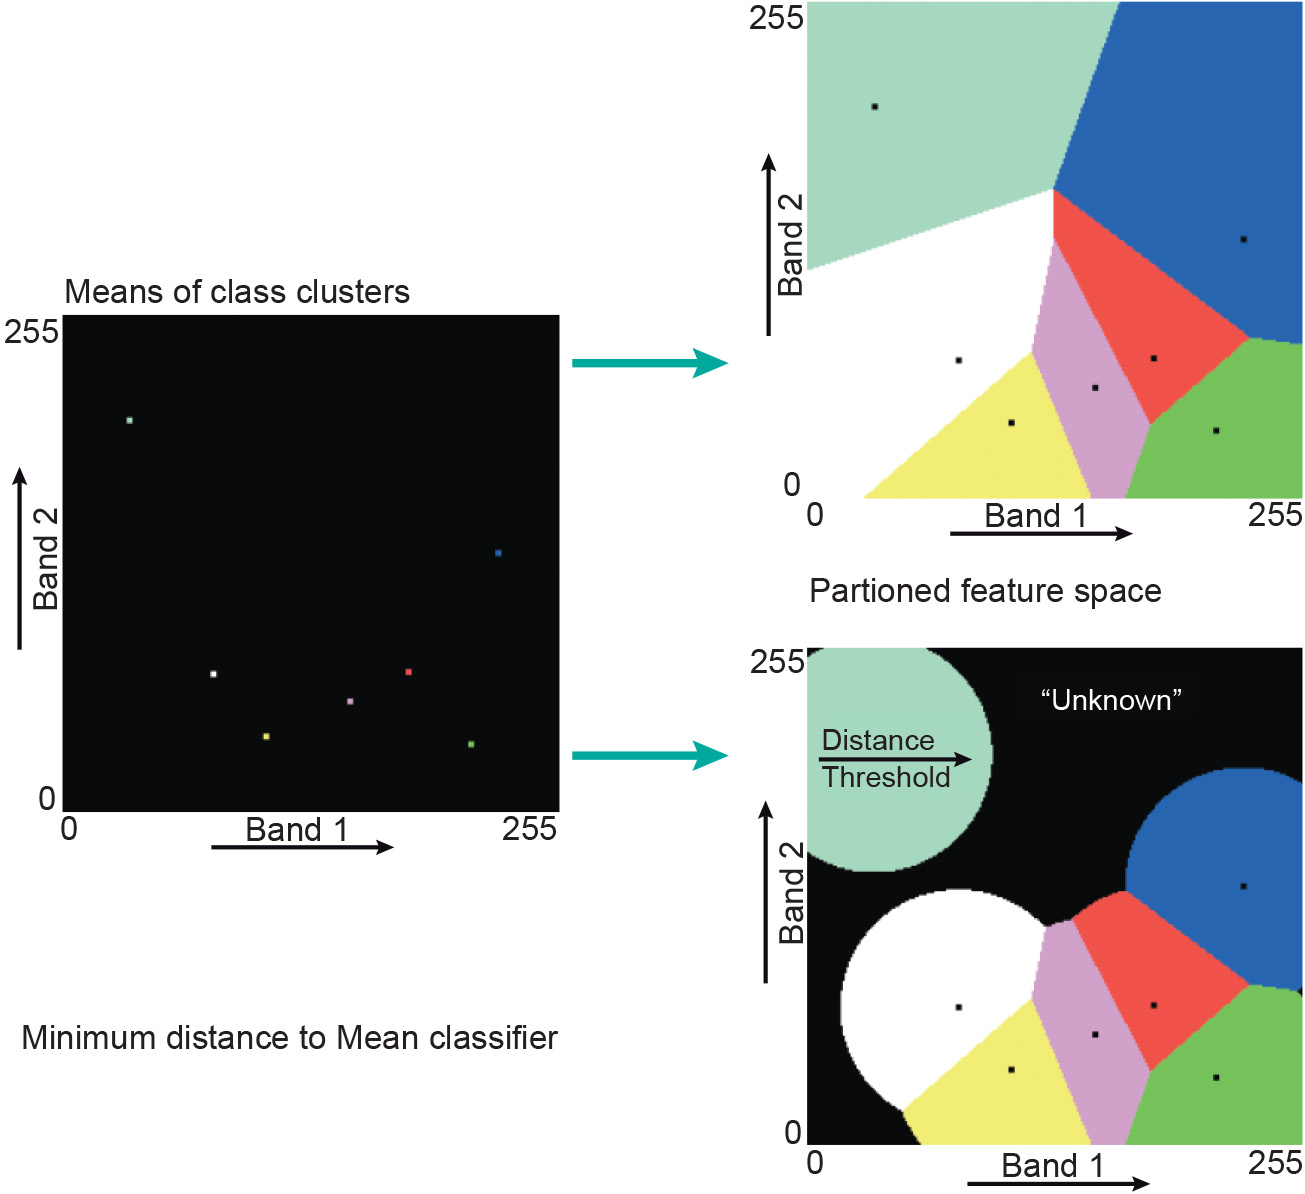
A further disadvantage of the MDM classifier is that it does not take the class variability into account: some clusters are small and dense, while others are large and dispersed. Maximum likelihood classification does, however, take class variability into account.
Maximum Likelihood classifier
The Maximum likelihood (ML) classifier considers not only the cluster centres but also the shape, size and orientation of the clusters. This is achieved by calculating a statistical distance based on the mean values and covariance matrix of the clusters. The statistical distance is a probability value: the probability that observation x belongs to specific cluster. A cell is assigned to the class (cluster) for which it has the highest probability. The assumption of most ML classifiers is that the statistics of the clusters follow a normal (Gaussian) distribution.

For each cluster, what are known as “equiprobability contours” can be drawn around the centres of the clusters. Maximum likelihood also allows the operator to define a threshold distance by defining a maximum probability value. A small ellipse centred on the mean defines the values with the highest probability of membership of a class. Progressively larger ellipses surrounding the centre represent contours of probability of membership to a class, with the probability decreasing the further away from the centre. Figure 3 shows the decision boundaries for a situation with and without threshold distance.
Outgoing relations
- Classification Algorithm is part of Digital Image Classification
Incoming relations
- Supervised Image Classfication Algorithm is a kind of Classification Algorithm
- Unsupervised Image Classification Algorithm is a kind of Classification Algorithm