[CP-10] Social Media Analytics
Social media streams have emerged as new sources to support various geospatial applications. However, traditional geospatial tools and systems lack the capacities to process such data streams, which are generated dynamically in extremely large volumes and with versatile contents. Therefore, innovative approaches and frameworks should be developed to detect an emerging event discussed over the social media, understand the extent, consequences of the event, as well as it time-evolving nature, and eventually discover useful patterns. In order to harness social media for geospatial applications, this entry introduces social media analytics technologies for harvesting, managing, mining, analyzing and visualizing the spatial, temporal, text, and network information of social media data.
Introduction
Topic Description:
- Definitions
- Background
- Workflow
- Geospatial Applications
social media: Any online platform or channel for user generated content (e.g., videos, text messages and photos).
social media analytics (SMA): A research field integrating knowledge from multiple disciplines to provide information system research with methodological foundations for collecting, modeling, analyzing, summarizing and visualizing social media data from both research and practical perspectives (Stieglitz, Dang-Xuan, Bruns, & Neuberger, 2014). It focuses on developing informatics tools and frameworks to process and mine social media data, usually driven by specific requirements from a particular application (Zeng, Chen, Lusch, & Li, 2010).
natural language processing (NLP): A field of computer science, artificial intelligence and linguistics focusing on the interactions between computers and human (natural) languages. Specifically, it is the process of a computer extracting meaningful information from natural language input and/or producing natural language output.
text mining: The process of discovering information in a large number of text collections and automatically identifying meaningful patterns and relationships in textual data.
sentiment analysis: The application of NLP, computational linguistics and text analytics to identify and extract subjective information in source materials
With the recent flourish of smart devices (e.g., smartphones and tablets), and location based services, people are sharing their experiences, stories and photos about the events (e.g., political, social or disaster events) in their daily lives through the Internet at an unprecedented speed and scale. It is reported that 69% of American adults (age 18 and older) internet users are using at least one type of social media such as Twitter, Facebook, Instagram, Flickr, and YouTube (see the Pew Research Center's Social Media fact sheet(link is external) for more information). Additionally, a greater number of people are moving beyond being content readers and are actively engaging as content contributors (Fisher & Miller, 2011). As such, vast volumes of data are generated in a variety of social media sites. For example, about a billion registered users and 100 million daily action users are publishing 550 million tweets per day in July 2015 (Smith, 2015).
A large number of social media messages include spatial information in the form of geo-tags, user profiles, or place names in the messages, which in turn can be used to generate spatial social networks in the format of maps and information landscapes using real-world physical locations (Tsou & Yang, 2016). Within the spatial social networks, space-time analyses and mining can be applied to understand the diffusion of information, and uncover the spatiotemporal patterns of network elements. As a result, social media data are transforming how geoscientists conduct their research, and offer many new exciting opportunities for studying various geospatial events or phenomenon, such as natural hazards (Huang & Xiao, 2015), diseases (Schmidt, 2012), and crimes (Gerber, 2014), which typically rely on data produced from traditional data collection methods (e.g., surveys).
However, using traditional geospatial tools and systems is impractical, if not impossible, to handle such massive heterogeneous, real-time datasets. Social media data are not only rich in spatial and temporal information, but also network (e.g., information flow, connections and interactions among social media users) and contextual information in various formats, including images, videos and especially texts. These information components together reflect what, where and when happen in our real word (physical space) through social media (cyberspace). While dealing with social media data, traditional geospatial tools and systems have a number of limitations: the data storage is normally constrained; the data model and management are formatted yet incapable of managing unstructured, dynamic data and inflexible for expansion; the data processing is pronounced yet its capabilities are restricted to spatial component (locations) and associated attributes of geographic information, but limited to handling contextual and network information of social media data. In other words, these novel data streams are not readily usable to support various geospatial applications.
Recently, different informatics tools and frameworks have to be developed to collect, manage, process, analyze, and visualize social media data, usually driven by specific requirements from a particular application (Zeng et al., 2010). Correspondingly, a new research field emerged as social media analytics (SMA), which combined knowledge from multiple disciplines to provide information system research with methodological foundations for collecting, modeling, analyzing, summarizing and visualizing social media data from both research and practical perspectives (Stieglitz et al., 2014). In order to harness social media data for geospatial applications, this entry introduces social media analytics techniques for harvesting, managing, mining, analyzing and visualizing various components of such data.
While different frameworks and workflows may be developed to leverage social media for different applications, SMA typically involves a three-stage process, “capture”, “understand” and “present” (Fan & Gordon, 2014). Considering geospatial applications deal with not only network, contextual and temporal information as general applications, but most importantly the spatial information, a five-stage process is more often used, including 1) data collection, 2) data storage, 3) text preprocessing and mining, 4) spatial/spatiotemporal analysis and data mining, and 5) geovisualization (Figure 1). The first two steps focus on obtaining, archiving and managing relevant social media, which corresponds to “capture” process in Fan and Gordon’s work. The following two data processing and mining stages aim to “understand” the collected data, whereas geovisualization can help “present” the data. It is to note that while this five-stage SMA workflow is most common, it is not the only approach for geospatial applications. In some cases, certain stages (text mining or spatiotemporal mining) may not be necessary, or an extra stage (e.g., image or video processing) is required to process social media data.
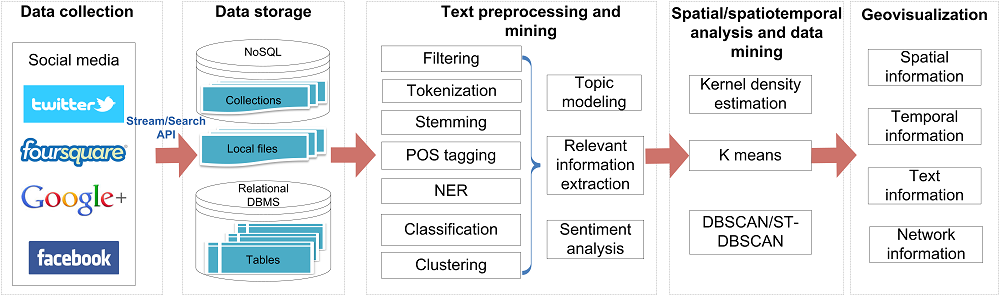
Figure 1. A workflow of leveraging social media for geospatial applications.
3.1 Data collection
A workflow of leveraging social media for a geospatial application typically starts with data collection which obtains relevant social media data by monitoring or tracking various social media data sources. Depending on the data source, the ingestion of social media data into the data storage can be automatic using open application programming interfaces (APIs), or manual. For example, Twitter provides both search and streaming APIs where search API returns a collection of relevant tweets(link is external) published in the past 7 days, and streaming API enables to collect real-time tweet stream. By registering an account and applying for access keys, third parties can harvest historic tweets matching pre-defined keywords and spatial boundary, or tweets posted in real-time. As Twitter only allows users limited access to historical tweets, tweets have to be archived in local hard drives in a real-time fashion. Many social networks, such as Wikipedia, offer free copies of all available content for the public users to programmatically or manually download at any time.
3.2 Data storage
Harvested data are typically stored locally and processed later for analysis. While social media data can be managed in different storage and file systems (e.g., flat files, relational databases and distributed file systems), social media data in general are stored in a non-traditional database (DB) system as they are unstructured, and massive in nature. In many cases, scalable NoSQL databases, such as MongoDB and HBase, are used to manage social media datasets efficiently. NoSQL databases match requirements of Big Data with high scalability, availability and fault-tolerance. However, they have limited support for spatial queries and operations (e.g., overlay and buffering) and therefore are mostly used to store the massive “raw” data, which are unprocessed or unanalyzed and may contain errors. Cleaned data (i.e., data after correction or removal of erroneous data) and value-added data (i.e., data that has been cleaned, analyzed, tagged and augmented with knowledge) (Batrinca & Treleaven, 2015) can be imported and stored in a spatial relational database system (e.g., PostgreSQl/PostGIS) for fast access, analysis and visualization.
3.3 Text preprocessing and mining
Much useful information in social networks such as Twitter is textual. For example, people post text messages related to damage, offering help, requesting services, fundraising or donation during a disaster. From the text, “actionable data” can be extracted to establish situational awareness or produce a crisis map (Huang & Xiao, 2015; Vieweg, Hughes, Starbird, & Palen, 2010). Therefore, text mining is a significant component in the SMA framework in order to understand the meaning and discover the patterns from the social media text content (Aggarwal & Wang, 2011).
Among the massive social media data collected during a period for a specific event (e.g., natural hazard), only a small portion of the messages are related and contribute to the analysis of the event (e.g., situational awareness). Due to the volume of data is far beyond the capabilities of manual examination, text mining tasks typically start with filtering out non-relevant messages and extracting relevant messages by using smart aggregation, automated text analysis and advanced filtering strategies (Chae et al., 2012).
After removing noisy messages, some basic text processing and linguistic analysis methods can be applied to derive useful information and insights from the remaining unstructured text data (Yang et al., 2016). For example, word count and vocabulary frequency analysis can identify the most frequently used keywords in social media texts, and pointwise mutual information (PMI) algorithm can find word co-occurrence. Next, various natural language processing (NLP) techniques can be leveraged to understand slang, context-specific words, and variants in spelling that are very common in the social network messages, and automatically adapt to the dynamic nature of language (Fisher & Miller, 2011). These NLP techniques can help computers analyze, understand, and derive meaning from human language by processing and transforming unstructured text data sets into a structured form.
One NLP task commonly applied on social media data is tokenization, which breaks text messages into a contiguous of n words (i.e., n-grams), such as uni-, bi- or tri-grams, corresponding to one, two and three consecutive words. Another example is named-entity recognition (NER), which identifies and categorizes atomic elements in text (e.g., Organizations, Persons, Locations, and Time). Sentiment analysis is also a common task for social media text mining to help examine public perceptions towards a specific topic or event (Stieglitz et al., 2014). As the application of NLP computational linguistics and text analytics, sentiment analysis can identify and extract subjective information in source materials.
Finally, more advanced text mining techniques based on machine learning algorithms then can be applied to the structured data sets generated by previous text preprocessing and NLP techniques to derive useful information. Machine learning algorithms are capable of automatically acquiring and integrating knowledge learned from experience, analytical observation, etc. The existing machine learning algorithms for text either focus on assigning pre-defined classes to text documents (classification) or automatically structure document collections to find groups of similar documents (clustering) (Hotho, Nürnberger, & Paaß, 2005). It is notable that the cleaned, structured data sets transformed from raw text data are high dimensional. To avoid long training time, machine learning algorithms should be carefully selected. Commonly used classification algorithms for text include decision trees, support vector machines, Naïve-Bayes classifier, and deep learning whereas K nearest neighborhood and K-Means are widely used for clustering.
3.4 Spatial/spatiotemporal analysis and data mining
Spatial/spatiotemporal (SST) analysis includes the transformations, manipulations, and methods that can be applied to spatial-temporal data to add value to them and reveal patterns and anomalies that are not immediately obvious. SST data mining provides the tools needed to analyze the locations (e.g., geo-tags of tweets) and temporal information of social media data. SST data mining techniques are widely used to detect previously unknown, but potentially useful patterns, such as SST outliers, associations and tele-couplings, predictive models, partitions and summarization, hotspots, and change patterns (Shekhar et al., 2015). In existing studies, each social media data entry is normally treated as a spatiotemporal (ST) point, and various SST analysis, data mining methods (e.g., clustering based approaches), and machine learning algorithms then can be employed to discover the patterns of these massive ST points.
In fact, much work and progress has been made to examine the spatial-temporal component of social media data for many geospatial applications (Padmanabhan et al., 2013). For example, kernel density estimation (KDE) method can be adopted to generate intensity maps for various geospatial applications supported by social media data, such as crime predication (Gerber, 2014). Clustering, one of the most widely used data mining methods, can group georeferenced social media points into clusters and gain insight into the characteristics of each cluster (Mennis & Guo, 2009). For example, K-means (Ashbrook & Starner, 2003) and density-based spatial clustering of applications with noise (DBSCAN) (Ester, Kriegel, Sander, & Xu, 1996), ST-DBSCAN - a spatiotemporal extension of DBSCAN, are commonly used to detect spatiotemporal hotspots from the ST points.
3.5 Geovisualization
As massive social media data are generated dynamically and continuously and social networks become larger and more complex, discovering spatiotemporal patterns, and reasoning about social dynamics via simple statistics and graphic tools (e.g., charts and histograms) are not very intuitive. Geovisualization utilizes mapping and visualization interfaces, techniques and methods to display the information, generate insights about information, and support human reasoning (White & Roth, 2010). Based on geolocation, geospsatial processing and geovisualization, social media data are converted into visualization maps and graphs representing cyberspace information landscapes reflected by a collection set of human perceptions and behaviors (Tsou et al., 2014).
While simple graphs are commonly used to present and analyze temporal information associated with social media data, two dimensional (2D) maps (e.g., hotspot or intensity maps) are widely used to help analyze and visualize the distribution of geo-tagged social media data across space (Gerber, 2014; Tsou et al., 2014). As static graphs and 2D maps lack interaction and analysis functions to examine the dynamics of geographic events in both space and time dimensions at the same time, a series of maps are typically applied to simulate the space-time interactions of ST event points generated through social networks. 3D geovisualization systems that integrates the time dimension, along with the 2D space also become popular to analyze social media datasets (Huang & Wong, 2015).
To represent and gain insights from network information (e.g., information flow and user connections), graph analysis emerges as a scientific approach for analysis and visual representation of complex networks (Aggarwal, 2011). It offers a way to understand the relationships, interactions, and patterns of the elements (e.g., users) within the network systems. Currently, many tools and software are developed to explore and manipulate networks, and deliver deeper understanding. Gephi (Gephi, 2017) is one of the interactive visualization and exploration platforms(link is external) that can be used for network systems. It can easily create social data connectors to map community organizations and networks.
Many recent studies have applied social media data to understand various aspects of human behavior, the physical environment, and social phenomena. This section introduces the studies and analysis of using social media for geospatial applications in the following aspects: 1) place of interest (POI) and recommender systems, 2) place boundary delineation, 3) human mobility, and 4) disaster management.
4.1 Place of interest and recommender systems
Place is an essential concept and defining places and associated boundaries is one of research thrusts in Geography (Hartshorne, 1939). A POI refers to a specific place that is useful or interesting to people, and receives a large number of visits (Hu et al., 2015). Based on the spatial extent and influence of the place, a place can be represented as different geographic features, such as a point (e.g., Eiffel tower in Paris, France), polyline (e.g., Golden Gate Bridge in San Francisco, California) or polygon (e.g., Paris and San Francisco). As a result, a POI is also known as point of interest (Ye, Yin, Lee, & Lee, 2011), area of interest (AOI) (Hu et al., 2015), or regions of attraction (ROA) in the literature.
The rapid development of mobile devices, wireless networks and Web 2.0 technology, has bloomed a number of location-based social networking services (LBSNs) that allows users to share their locations and location-related contents in various formats. The location data with context information, especially photos, not only capture the footprints of the place, but also record the culture and environment of a place offering exciting opportunities to examine how humans perceive, experience and describe a place and consequently detect POIs and its semantics (Liu et al., 2015). Based on geotagged photos, Hu et al. (2015) identified AOI using DBSCAN clustering algorithm, understood AOI by extracting distinctive textual tags and preferable photos, and discussed the spatiotemporal dynamics as well as some insights derived from the AOI. García-Palomares, Gutiérrez, & Míngue (2015) utilized photo-sharing services for identifying and analyzing the main tourist attractions in eight major European cities (García-Palomares, Gutiérrez, & Mínguez, 2015). These geo-tagged data capturing by users’ preferences and behavior over places, has also fostered research into novel recommender systems for facilitating users’ travels and social interactions. For example, Majid et al. (2014) proposed a system to recommend interesting tourist locations and interesting tourist travel sequences (i.e., sequence of tourist locations) from a collection of geotagged photos. Proposed system is capable of understanding context (i.e., time, date, and weather), as well as taking into account the collective wisdom of people, to make tourist recommendations (Majid, Chen, Mirza, Hussain, & Chen, 2015). Bao et al. (2016) categorized existing recommender systems for LBSNs in three taxonomies, organized by data sources (i.e., user profiles, user online histories, and user location histories), methodologies (i.e., content-based, link analysis-based, and collaborative filtering-based), and recommendation objectives (i.e., locations, users, activities, or social media), and summarized the goals and contributions of each system (Bao, Zheng, Wilkie, & Mokbel, 2015).
4.2 Place boundary delineation
Traditionally, places and their boundaries are determined using data describing the characteristics of various locations or the relationships among locations. These data most often are acquired from surveys conducted at various scales and thus expensive, or gathered for administrative purposes (Elwood, Goodchild, & Sui, 2012; Wong & Huang, 2017). Recently, social media brought new opportunities to determine the spatial extent of places (Vasardani, Winter, & Richter, 2013). For example, Flickr data have been used to determine the spatial extent of city centers or cores (Hollenstein & Purves, 2010), and provide a collective view of sense of place, in terms of significance and location (Li & Goodchild, 2012). Such spatial footprints associated with context represented as text or photos can not only describe individual place locations and spatial extents but also the relationship between places, such as hierarchy (Li & Goodchild, 2012). Virtual Syrian communities were identified by extracting locations of tweets mentioning “Syria” (Stefanidis et al., 2013). Thus, mentioning “something” in cyberspace is linked to the presence of “something” in a geographical space. Wong and Huang (2017) developed a generic approach based on the notion of place-name density mentioned in geo-tagged tweets to delineate the boundaries of two locations with the same levels of influence.
4.3 Human mobility
As social media data records humans’ life and behavior with high spatial and temporal resolution, those data can offer rich insights to human mobility patterns at both an individual or group level. Based on geo-tagged social media data, much progress has been made to mine and understand individuals’ daily movements, and urban mobility patterns (Huang & Wong, 2015; Liu et al., 2015; Longley, Adnan, & Lansley, 2015; Noulas, Scellato, Lathia, & Mascolo, 2012; Zheng, Zha, & Chua, 2012). For example, Longley et al. (2015) were able to characterize the different geotemporal activity patterns of different groups of users after inferencing Twitter users’ profile (i.e., age, gender, and ethnicity). Online trajectories collected from a group of users can be aggregated to examine collective movement behaviors (e.g., traffic flows between places) and measure spatial interactions (Liu et al., 2015). Using 35 million user check-ins from Foursquare, Noulas et al. (2012) developed various prediction strategies for mining user mobility features for next visit place prediction based on machine learning methods. Using Flickr data, Zheng et al. (2011) mine the people’s travel pattern at the local level of a tour destination by discovering a list of ROA, and then building a Markov chain model to investigate the tourist traffic flow among different ROAs (Zheng et al., 2012).
4.4 Disaster management
Because of the massive popularity of social media networks and their real time production of data, much work has been done to leverage these new data sources to support various disaster relevant analysis and management, such as disaster event detection and tracking (Sakaki, Okazaki, & Matsuo, 2010), disaster response and relief (Ashktorab, Brown, Nandi, & Culotta, 2014; Kumar, Barbier, Abbasi, & Liu, 2011; Purohit, Castillo, Diaz, Sheth, & Meier, 2013), and damage assessment (Cervone et al., 2016). For example, Sakaki et al. (2010) examined the real-time interaction of events such as earthquakes and Twitter and developed a probabilistic spatiotemporal model for the target event that can find the center and the trajectory of the event location. To track, analyze, and monitor tweets, and to help first responders gain situational awareness immediately after a disaster or crisis, Kumar et al. (2011) presented a tool with data analytical and visualization functionalities, such as near real-time trending, data reduction, and historical review. SensePlace2 was also developed to enable understanding of place, time, and theme components of evolving situations during crisis events using Twitter data (MacEachren et al., 2011). Similarly, Ashktorab et al. (2014) developed a Twitter - mining tool, known as Tweedr, to extract actionable information for disaster relief workers during natural disasters. Purohit et al. (2013) developed machine learning methods to automatically identify and match needs and offers communicated via social media for items and services such as shelter, money, clothing, etc. Cervone et al. (2016) fused traditional remote sensing data and social media data to estimate flood extent and identify affected roads during a flood disaster.
Instructional assessment questions
- What is the five-stage process for social media analytics?
- How to select an appropriate database system to store and manage the social media data for a specific application?
- How to discover the spatial patterns of the geo-tagged social media data related to a topic?
- Any other geospatial application not discussed in this entry that can benefit from social media data? Describe how social media data should be managed and manipulated to support this application.
Additional resources
- Batrinca, B., & Treleaven, P. C. (2015). Social media analytics: a survey of techniques, tools and platforms. AI & SOCIETY, 30(1), 89-116. DOI: 10.1007/s00146-014-0549-4
- Kumar, S., Morstatter, F., & Liu, H. (2013). Twitter data analytics: Springer Science & Business Media.
External resources
- Aggarwal, C. C. (2011). An introduction to social network data analytics. Social network data analytics, 1-15. DOI: 10.1007/978-1-4419-8462-3_1
- Aggarwal, C. C. & Wang, H. (2011). Text mining in social networks. Social network data analytics, 353-378. DOI: 10.1007/978-1-4419-8462-3_13
- Ashbrook, D. & Starner, T. (2003). Using GPS to learn significant locations and predict movement across multiple users. Personal and Ubiquitous Computing, 7(5), 275-286.
- Ashktorab, Z., Brown, C., Nandi, M., & Culotta, A. (2014). Tweedr: Mining twitter to inform disaster response. Proc. of ISCRAM.
- Bao, J., Zheng, Y., Wilkie, D., & Mokbel, M. (2015). Recommendations in location-based social networks: a survey. GeoInformatica, 19(3), 525-565. DOI: 10.1007/s10707-014-0220-8
- Batrinca, B. & Treleaven, P. C. (2015). Social media analytics: a survey of techniques, tools and platforms. AI & SOCIETY, 30(1), 89-116. DOI: 10.1007/s00146-014-0549-4
- Cervone, G., Sava, E., Huang, Q., Schnebele, E., Harrison, J., & Waters, N. (2016). Using Twitter for tasking remote-sensing data collection and damage assessment: 2013 Boulder flood case study. International Journal of Remote Sensing, 37(1), 100-124. DOI: 10.1080/01431161.2015.1117684
- Chae, J., Thom, D., Bosch, H., Jang, Y., Maciejewski, R., Ebert, D. S., & Ertl, T. (2012). Spatiotemporal social media analytics for abnormal event detection and examination using seasonal-trend decomposition. Paper presented at the Visual Analytics Science and Technology (VAST), 2012 IEEE Conference on.
- Elwood, S., Goodchild, M. F., & Sui, D. Z. (2012). Researching volunteered geographic information: Spatial data, geographic research, and new social practice. Annals of the Association of American Geographers, 102(3), 571-590. DOI: 10.1080/00045608.2011.595657
- Ester, M., Kriegel, H.-P., Sander, J., & Xu, X. (1996). A density-based algorithm for discovering clusters in large spatial databases with noise. Paper presented at the Kdd.
- Fan, W. & Gordon, M. D. (2014). The power of social media analytics. Communications of the ACM, 57(6), 74-81. DOI: 10.1145/2602574
- Fisher, B. & Miller, H. (2011). Social Media Analytics.
- García-Palomares, J. C., Gutiérrez, J., & Mínguez, C. (2015). Identification of tourist hot spots based on social networks: A comparative analysis of European metropolises using photo-sharing services and GIS. Applied Geography, 63, 408-417. DOI: 10.1016/j.apgeog.2015.08.002
- Gephi. (2017). Open Graph Viz Platform. Retrieved November 14, 2017, from https://gephi.org/
- Gerber, M. S. (2014). Predicting crime using Twitter and kernel density estimation. Decision Support Systems, 61, 115-125. DOI: 10.1016/j.dss.2014.02.003
- Hartshorne, R. (1939). The nature of geography: A critical survey of current thought in the light of the past. Annals of the Association of American Geographers, 29(3), 173-412.
- Hollenstein, L., & Purves, R. (2010). Exploring place through user-generated content: Using Flickr tags to describe city cores. Journal of Spatial Information Science, 2010(1), 21-48. DOI: 10.5311/JOSIS.2010.1.3
- Hotho, A., Nürnberger, A., & Paaß, G. (2005). A brief survey of text mining. Paper presented at the Ldv Forum.
- Hu, Y., Gao, S., Janowicz, K., Yu, B., Li, W., & Prasad, S. (2015). Extracting and understanding urban areas of interest using geotagged photos. Computers, Environment and Urban Systems, 54, 240-254. DOI: 10.1016/j.compenvurbsys.2015.09.001
- Huang, Q., & Wong, D. W. (2015). Modeling and Visualizing Regular Human Mobility Patterns with Uncertainty: An Example Using Twitter Data. Annals of the Association of American Geographers, 1-19. DOI: 10.1080/00045608.2015.1081120
- Huang, Q., & Xiao, Y. (2015). Geographic Situational Awareness: Mining Tweets for Disaster Preparedness, Emergency Response, Impact, and Recovery. International Journal of Geo-Information, 4(3),19. DOI: 10.3390/ijgi4031549
- Kumar, S., Barbier, G., Abbasi, M. A., & Liu, H. (2011). TweetTracker: An Analysis Tool for Humanitarian and Disaster Relief. Paper presented at the ICWSM.
- Li, L., & Goodchild, M. F. (2012). Constructing places from spatial footprints. Paper presented at the Proceedings of the 1st ACM SIGSPATIAL international workshop on crowdsourced and volunteered geographic information.
- Liu, Y., Liu, X., Gao, S., Gong, L., Kang, C., Zhi, Y., . . . Shi, L. (2015). Social sensing: A new approach to understanding our socioeconomic environments. Annals of the Association of American Geographers, 105(3), 512-530. DOI: 10.1080/00045608.2015.1018773
- Longley, P. A., Adnan, M., & Lansley, G. (2015). The geotemporal demographics of Twitter usage. Environment and Planning A, 47(2), 465-484. DOI: 10.1068/a130122p
- MacEachren, A. M., Jaiswal, A., Robinson, A. C., Pezanowski, S., Savelyev, A., Mitra, P., . . . Blanford, J. (2011). Senseplace2: Geotwitter analytics support for situational awareness. Paper presented at the Visual Analytics Science and Technology (VAST), 2011 IEEE Conference on.
- Majid, A., Chen, L., Mirza, H. T., Hussain, I., & Chen, G. (2015). A system for mining interesting tourist locations and travel sequences from public geo-tagged photos. Data & Knowledge Engineering, 95, 66-86. DOI: 10.1016/j.datak.2014.11.001
- Mennis, J., & Guo, D. (2009). Spatial data mining and geographic knowledge discovery—An introduction. Computers, Environment and Urban Systems, 33(6), 403-408. DOI: 10.1016/j.compenvurbsys.2009.11.001
- Noulas, A., Scellato, S., Lathia, N., & Mascolo, C. (2012). Mining user mobility features for next place prediction in location-based services. Paper presented at the Data mining (ICDM), 2012 IEEE 12th international conference on.
- Padmanabhan, A., Wang, S., Cao, G., Hwang, M., Zhao, Y., Zhang, Z., & Gao, Y. (2013). FluMapper: an interactive CyberGIS environment for massive location-based social media data analysis. Paper presented at the Proceedings of the Conference on Extreme Science and Engineering Discovery Environment: Gateway to Discovery.
- Purohit, H., Castillo, C., Diaz, F., Sheth, A., & Meier, P. (2013). Emergency-relief coordination on social media: Automatically matching resource requests and offers. First Monday, 19(1). DOI: 10.5210/fm.v19i1.4848
- Sakaki, T., Okazaki, M., & Matsuo, Y. (2010). Earthquake shakes Twitter users: real-time event detection by social sensors. Paper presented at the Proceedings of the 19th international conference on World wide web.
- Schmidt, C. W. (2012). Using social media to predict and track disease outbreaks. Environmental health perspectives, 120(1), A31. DOI: 10.1289/ehp.120-a30
- Shekhar, S., Jiang, Z., Ali, R. Y., Eftelioglu, E., Tang, X., Gunturi, V., & Zhou, X. (2015). Spatiotemporal data mining: A computational perspective. ISPRS International Journal of Geo-Information, 4(4), 2306-2338. DOI: 10.3390/ijgi4042306
- Smith, C. (2015). By The Numbers: 150+ Amazing Twitter Statistics. Accessibile through http://expandedramblings.com/index.php/march-2013-by-the-numbers-a-few-amazing-twitter-stats/ (Accessed Sep 21st, 2015)
- Stefanidis, A., Cotnoir, A., Croitoru, A., Crooks, A., Rice, M., & Radzikowski, J. (2013). Demarcating new boundaries: mapping virtual polycentric communities through social media content. Cartography and Geographic Information Science, 40(2), 116-129. DOI: 10.1080/15230406.2013.776211
- Stieglitz, S., Dang-Xuan, L., Bruns, A., & Neuberger, C. (2014). Social media analytics. Wirtschaftsinformatik, 56(2), 101-109. DOI: 10.1007/s11576-014-0407-5
- Tsou, M.-H., & Yang, J.-A. (2016). Spatial Social Networks. International Encyclopedia of Geography: People, the Earth, Environment and Technology: John Wiley & Sons, Ltd. DOI: 10.1002/9781118786352.wbieg0904
- Tsou, M.-H., Kim, I.-H., Wandersee, S., Lusher, D., An, L., Spitzberg, B., . . . Yang, J.-A. (2014). Mapping ideas from cyberspace to realspace: visualizing the spatial context of keywords from web page search results. International Journal of Digital Earth, 7(4), 316-335. DOI: 10.1080/17538947.2013.781240
- Vasardani, M., Winter, S., & Richter, K.-F. (2013). Locating place names from place descriptions. International Journal of Geographical Information Science, 27(12), 2509-2532. DOI: 10.1080/13658816.2013.785550
- Vieweg, S., Hughes, A. L., Starbird, K., & Palen, L. (2010). Microblogging during two natural hazards events: what twitter may contribute to situational awareness. Paper presented at the Proceedings of the SIGCHI conference on human factors in computing systems.
- White, J. J., & Roth, R. E. (2010). TwitterHitter: Geovisual analytics for harvesting insight from volunteered geographic information. Paper presented at the Proceedings of GIScience.
- Wong, D. W., & Huang, Q. (2017). “Voting with Their Feet”: Delineating the Sphere of Influence Using Social Media Data. ISPRS International Journal of Geo-Information, 6(11), 325. DOI: 10.3390/ijgi6110325
- Yang, J.-A., Tsou, M.-H., Jung, C.-T., Allen, C., Spitzberg, B. H., Gawron, J. M., & Han, S.-Y. (2016). Social media analytics and research testbed (SMART): Exploring spatiotemporal patterns of human dynamics with geo-targeted social media messages. Big Data & Society, 3(1), 2053951716652914. DOI: 10.1177/2053951716652914
- Ye, M., Yin, P., Lee, W.-C., & Lee, D.-L. (2011). Exploiting geographical influence for collaborative point-of-interest recommendation. Paper presented at the Proceedings of the 34th international ACM SIGIR conference on Research and development in Information Retrieval.
- Zeng, D., Chen, H., Lusch, R., & Li, S.-H. (2010). Social media analytics and intelligence. IEEE Intelligent Systems, 25(6), 13-16. DOI: 10.1109/MIS.2010.151
- Zheng, Y.-T., Zha, Z.-J., & Chua, T.-S. (2012). Mining travel patterns from geotagged photos. ACM Transactions on Intelligent Systems and Technology (TIST), 3(3), 56. DOI: 10.1145/2168752.2168770
Learning outcomes
-
28 - Define social media, social media analytics, natural language processing and text mining.
Define social media, social media analytics, natural language processing and text mining.
-
29 - Describe the general workflow of social media analytics for geospatial applications.
Describe the general workflow of social media analytics for geospatial applications.
-
30 - Discuss the file and database systems (e.g., NoSQL databases) can be leveraged to manage and manipulate social media data.
Discuss the file and database systems (e.g., NoSQL databases) can be leveraged to manage and manipulate social media data.
-
31 - Describe the techniques (e.g., text preprocessing and NLP) that can help computers analyze, understand, and derive meaning from human language.
Describe the techniques (e.g., text preprocessing and NLP) that can help computers analyze, understand, and derive meaning from human language.
-
32 - Discuss spatial/spatiotemporal analysis and data mining algorithms and methods that can be used to reveal meaningful information and patterns from social media data.
Discuss spatial/spatiotemporal analysis and data mining algorithms and methods that can be used to reveal meaningful information and patterns from social media data.
-
33 - Discuss common geovisualization methods (e.g., graphs and maps) and tools for mapping and visualizing different components of the social media data (e.g., geo-tags, temporal information, and users).
Discuss common geovisualization methods (e.g., graphs and maps) and tools for mapping and visualizing different components of the social media data (e.g., geo-tags, temporal information, and users).
-
34 - Compare and contrast two geospatial applications that can leverage social media data from the perspectives of techniques, tools, and approaches to process and mine social media data.
Compare and contrast two geospatial applications that can leverage social media data from the perspectives of techniques, tools, and approaches to process and mine social media data.
Outgoing relations
- [CP-10] Social Media Analytics is subconcept of Computing Platforms
Contributors
-
Huang, Qunying (2018). Social Media Analytics. The Geographic Information Science & Technology Body of Knowledge (1st Quarter 2018 Edition), John P. Wilson (ed).
This entry was first published on March 19, 2018. No earlier editions exist.
https://doi.org/10.22224/gistbok/2018.1.10