ESDA Maps
Some of the most effective ESDA techniques are those based on various forms of thematic maps.
Explanation
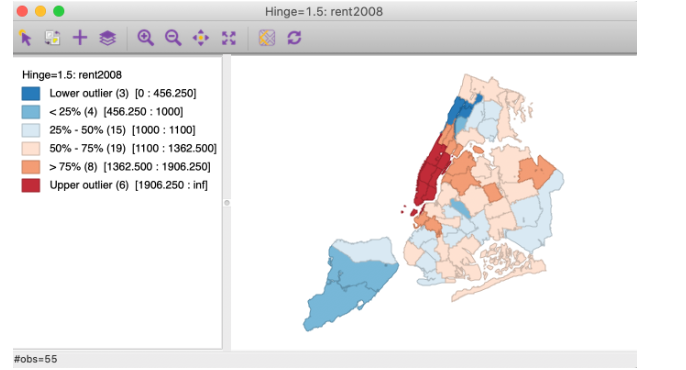
Box map is the mapping counterpart of the idea behind a box plot. The point of departure is again a quantile map, more specifically, a quartile map. But the four categories are extended to six bins, to separately identify the lower and upper outliers. The definition of outliers is a function of a multiple of the inter-quartile range (IQR), the difference between the values for the 75 and 25 percentile. (source: https://geodacenter.github.io/workbook/3a_mapping/lab3a.html#box-map)
Conditioned choropleth map : The data-analytic objective is to promote better-directed hypothesis generation about the variation of a dependent variable. The Conditioned choropleth map approach does this by partitioning the data into subsets to control the variation in the dependent variable that is associated with two or more conditioning variables. (source: http://publichealthintelligence.org/content/geography-diabetes-us-conditioned-map)
Cartogram types of maps distort reality to convey information. They resize and exaggerate any variable on an attribute value. (source: https://gisgeography.com/cartogram-maps/)
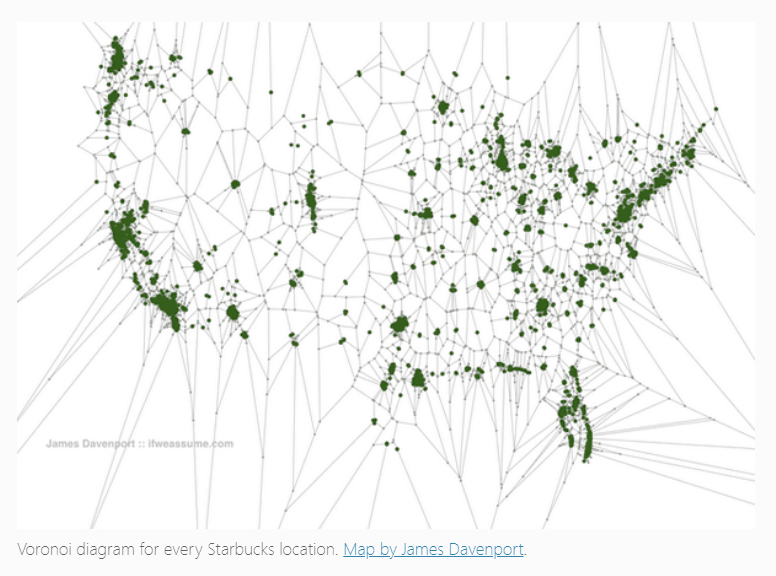
Voronoi Diagrams are convex polygons that are generated by a single point and the generating points are closer to their polygon points than other polygon points. These polygons represent a division of a plane in areas based on a defined distance to points. Each partition is called a cell. Different forms of tessellation define different types of polygon layouts. Voronoi diagrams are also called Thiessen polygons, where they often use Delaunay criterion to calculate. (source:https://www.gislounge.com/voronoi-diagrams-and-gis/)
Outgoing relations
- ESDA Maps is a kind of ESDA