Bivariate Analysis
Bivariate analysis means the analysis of bivariate data. It is one of the simplest forms of statistical analysis, used to find out if there is a relationship between two sets of values. It usually involves the variables X and Y (source: https://www.statisticshowto.com/bivariate-analysis/).
Explanation
There are several ways to describe and analyse bivariate data. Here we discuss few such types.
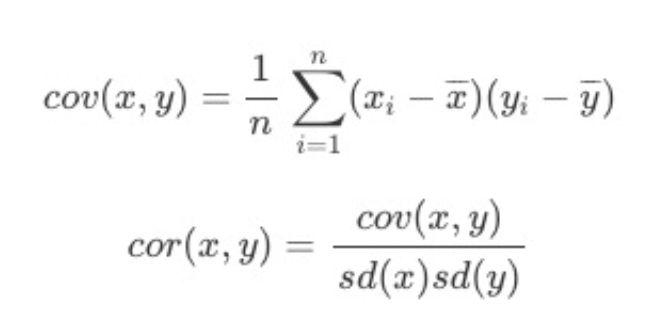
Covariance and correlation gives the relationship between two variables quantitatively. Here the cov (x,y) and cor (x,y) represents the covariance and correlation between two variables x and y respectively.
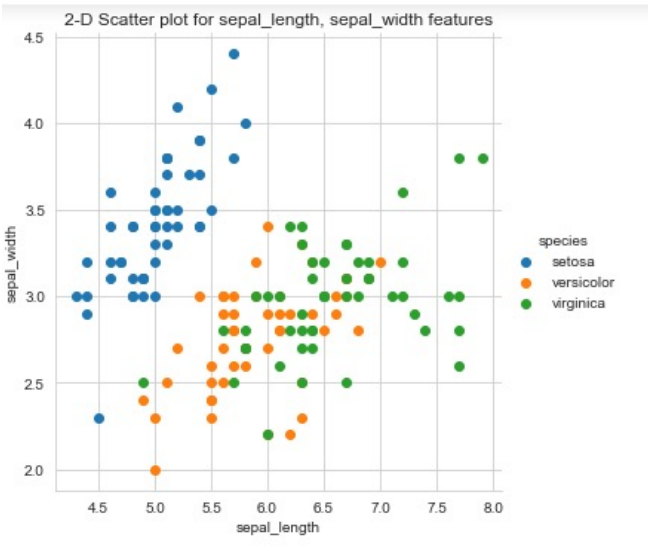
2-D Scatter Plots: They can show the linear relationship between two variables. Below figure shows the scatter plot for sepal length and sepal width features of flower species.
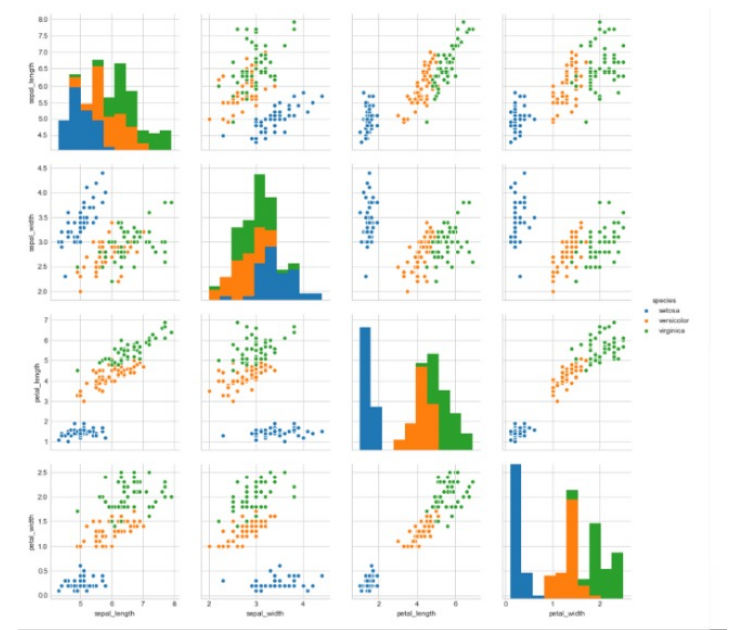
Pair-plot is a matrix of scatterplots that lets you understand the pairwise relationship between different variables in a dataset. (source: https://www.statology.org/pairs-plot-in-python/#:~:text=A%20pairs%20plot%20is%20a,different%20variables%20in%20a%20dataset.)
Outgoing relations
- Bivariate Analysis is a kind of EDA