Univariate Analysis
In univariate cases, only a single variable is considered in the analysis. Patterns in univariate data can be analyzed using statistics like mean, variance, standard deviation, minimum, maximum and range. Univariate data can be described using options like histogram, boxplot, Probability Density Function(PDF), etc.
Explanation
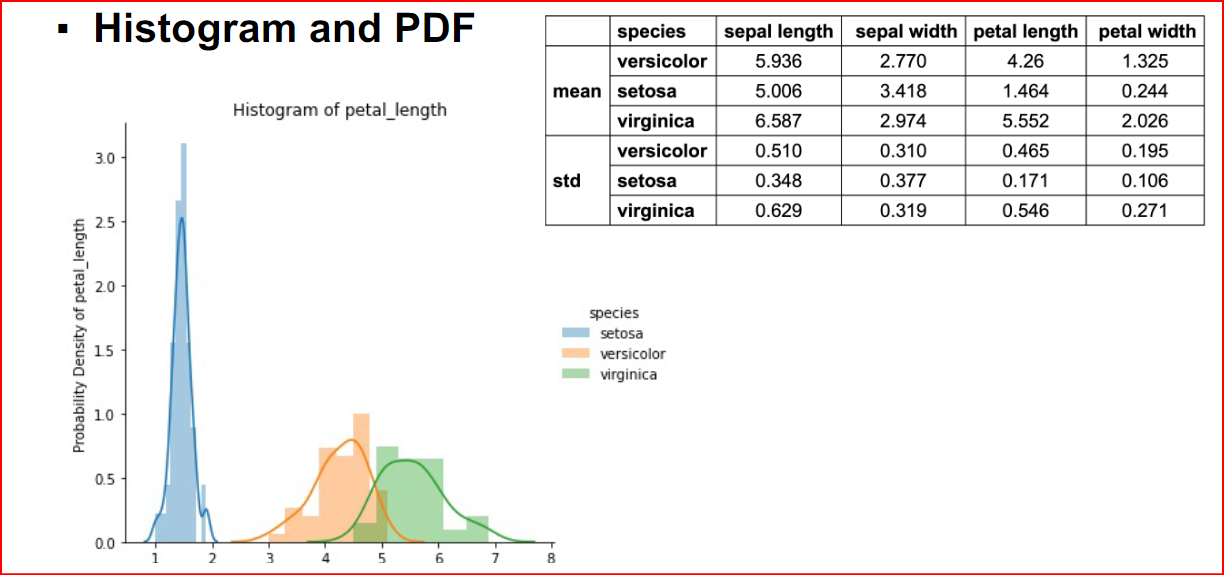
Histograms are useful tools for representing the distribution of data They can be used to judge central tendency (mean, median, mode), variation (standard deviation, variance), modality (unimodal or multi-modal), and graphical assessment of distributional assumptions (Normality). source:https://rpubs.com/corey_sparks/105700
Probability Density Function (PDF) is used to specify the probability of the random variable falling within a particular range of values, as opposed to taking on any one value. This probability is given by the integral of this variable’s PDF over that range — that is, it is given by the area under the density function but above the horizontal axis and between the lowest and greatest values of the range. Source: https://towardsdatascience.com/understanding-boxplots-5e2df7bcbd51
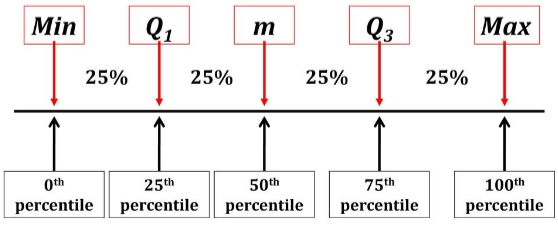
Percentile: Given a vector V of length N, the q-th percentile of V is the value q/100 of the way from the minimum to the maximum in a sorted copy of V.
Quartile: The q-th quantile of V is the value q of the way from the minimum to the maximum in a sorted copy of V.
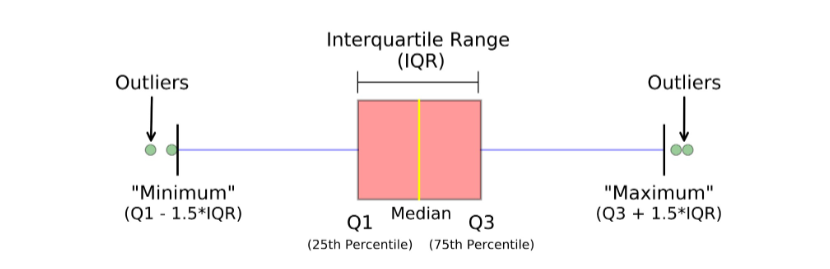
Box plot displays the five-number summary (the minimum, first quartile, median, third quartile, and maximum) of a set of data. Within the Box, 25th percentile to 75th percentile values are represented. Box plot can tell you about your outliers and what their values are.
(source: https://towardsdatascience.com/understanding-boxplots-5e2df7bcbd51)
For the above box plot figure the following are the summary,
- median (Q2/50th Percentile) : the middle value of the dataset.
- first quartile (Q1/25th Percentile) : the middle number between the smallest number (not the “minimum”) and the median of the dataset.
- third quartile (Q3/75th Percentile) : the middle value between the median and the highest value (not the “maximum”) of the dataset.
- interquartile range (IQR) : 25th to the 75th percentile.
- whiskers are shown in blue and outliers are shown as green circles
- “maximum” : Q3 + 1.5*IQR
- “minimum” : Q1 -1.5*IQR
Outgoing relations
- Univariate Analysis is a kind of EDA