Colored hillshade
Introduction
The output of operation "DEM Visualization" is a colored hillshade product based on the DEM that was used. The illumination directions from west, north‐west and north are merged using different colors to generate this effect.
By manually adding the following layers, a nice output is created:
1) The original "eth_dem_fin" DEM, with specific colors (ElevationMeter) and 45% transparency
2) The base map “country boundaries”, using black color for the boundaries
3) The base map “rivers”, selecting “Dodgerblue” as the single color
4) The map “Eth_inland_water"
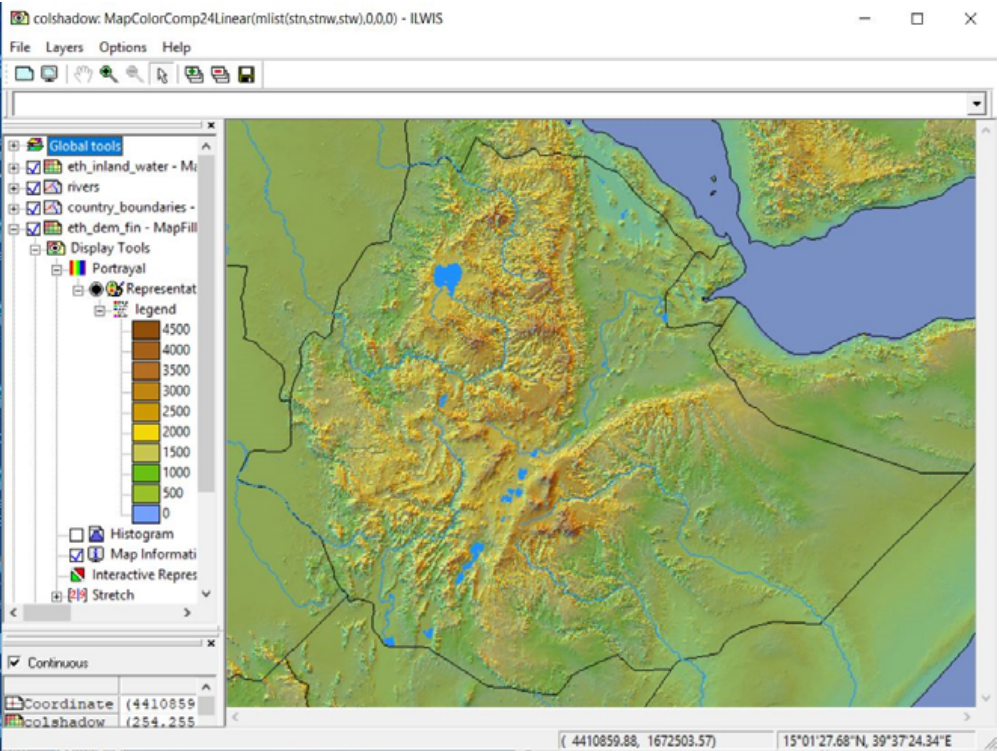
The final result (all 5 layers) would look like this:
Incoming relations
- DEM Visualization output Colored hillshade