2 - Spatial data modelling: computer representations
Explain and be able to apply basic vector and raster spatial data structures including selecting a suitable data structure for geographic phenomena (level 1, 2 and 3).
Concepts
-
Spatial Data Layering
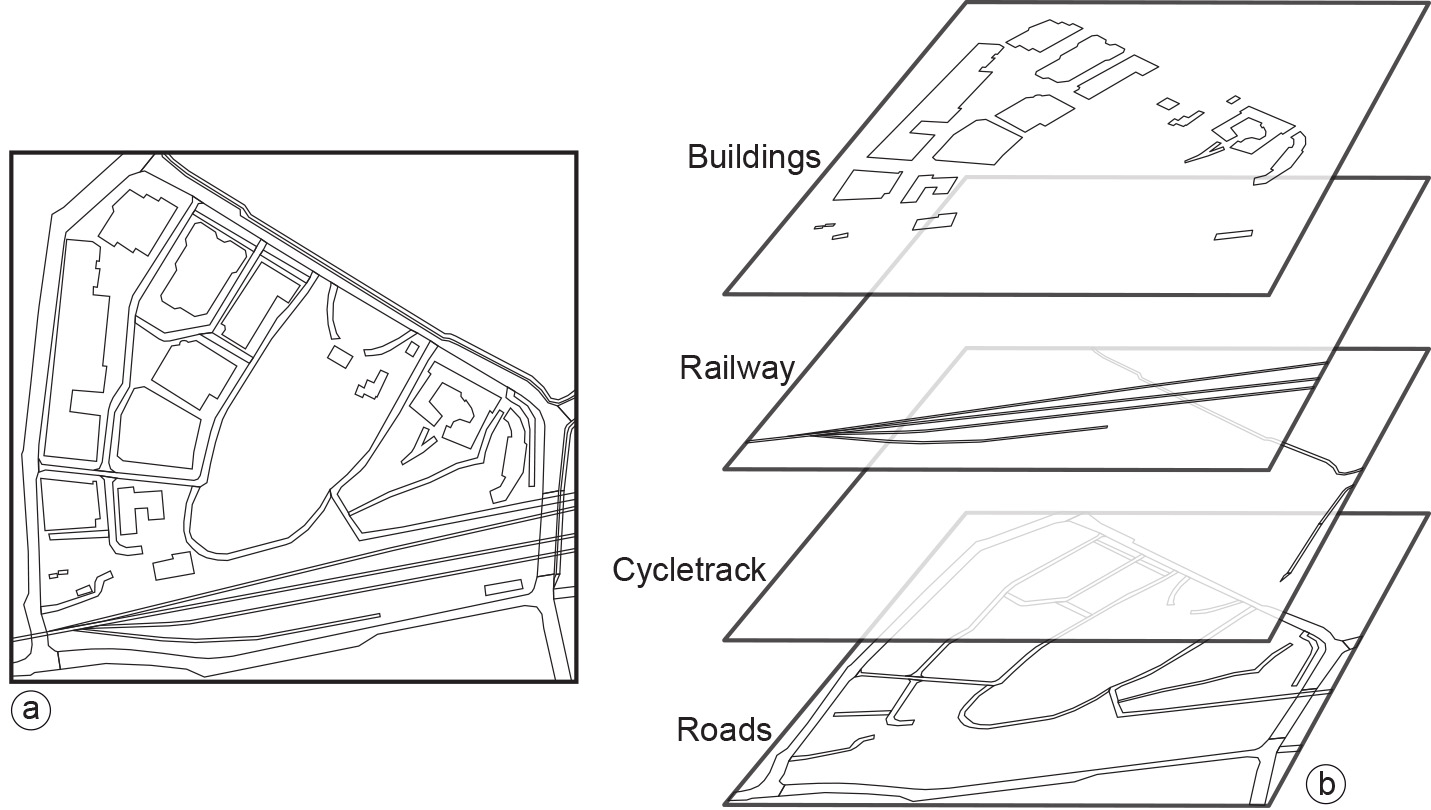
A spatial data layer is either a representation of a continuous or discrete field, or a collection of objects of the same kind. The main principle of data organization applied in a GIS is that of spatial data layers. Usually, the data are organized such that similar elements are in a single data layer (Figure 1). For example, all telephone booth point objects would be in one layer, and all road line objects in another. A data layer contains spatial data, as well as attribute (i.e. thematic) data, which further describes the field or objects in the layer. Attribute data are quite often arranged in tabular form, maintained in some kind of geo-database.

Figure 1: Various objects displayed as area objects in a vector representation. Similar data types are stored in the same single layer (e.g. Buildings). For each different type a new layer is used (b). -
Map scale
In the practice of spatial data handling, one often comes across questions like “What is the resolution of the data?” or “At what scale is your data set?” Now that we have moved firmly into the digital age, these questions sometimes defy an easy answer. Map scale can be defined as the ratio between the distance on a printed map and the distance of the same stretch in the terrain.
A 1:50,000 scale map means that 1 cm on the map represents 50,000 cm (i.e. 500 m) in the terrain. “Large-scale” means that the ratio is relatively large, so typically it means there is much detail to see, as on a 1:1000 printed map. “Small-scale”, in contrast, means a small ratio, hence less detail, as on a 1:2,500,000 printed map.