Spectral reflectance curves
The curve showing the portion of the incident radiation that is reflected by a material as a function of wavelength. Sometimes called spectral signature.
Explanation
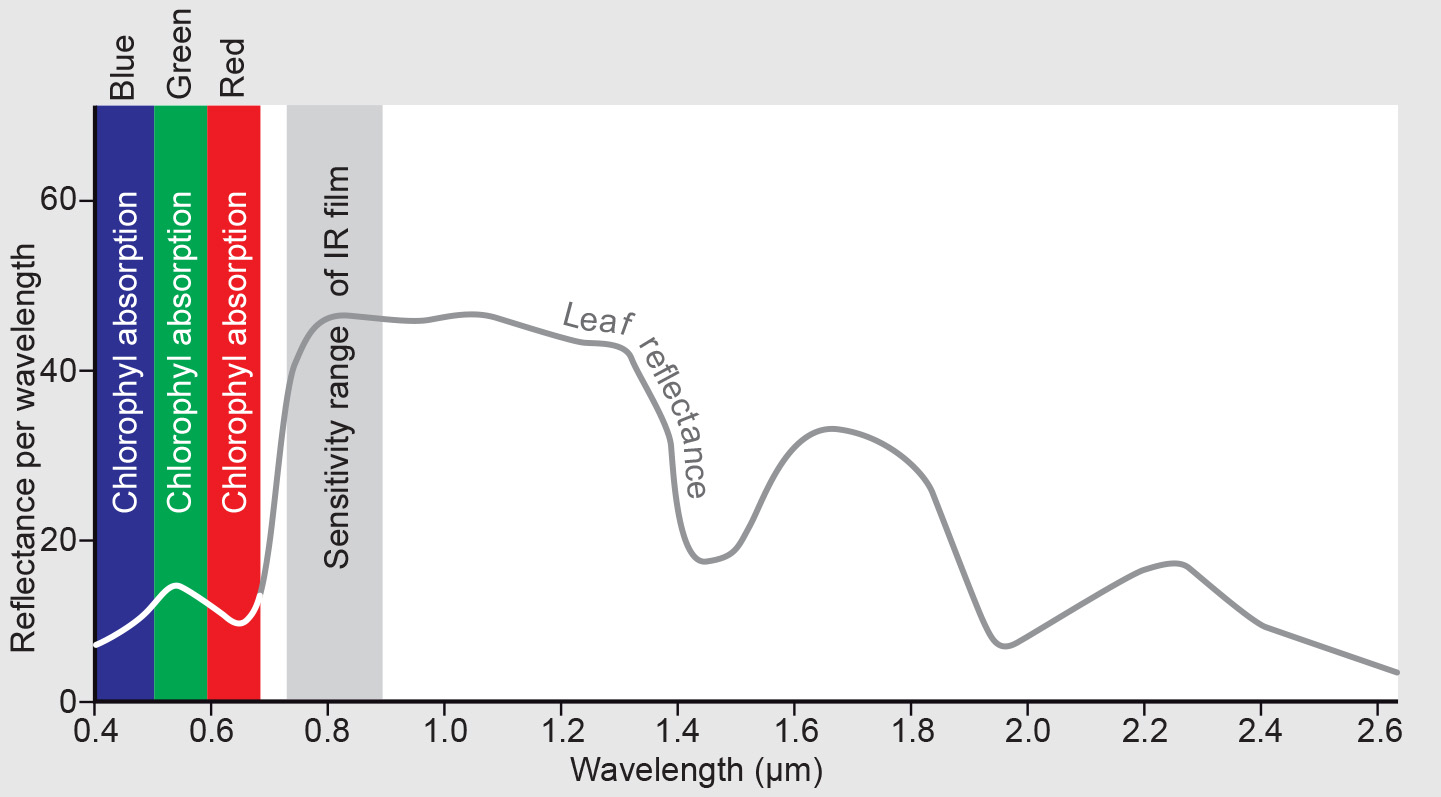
We can establish for each type of material of interest a reflectance curve. Such a curve shows the portion of the incident radiation ρ that is reflected as a function of wavelength λ (expressed as percentage; see Figure 1).
Remote sensors are sensitive to ranges, albeit narrow, of wavelengths, not just to one particular λ, for example the “spectral band” from λ=0.4 μm to λ=0.5 μm. The spectral reflectance curve can be used to estimate the overall reflectance in such bands by calculating the mean of reflectance measurements in the respective ranges. Reflectance measurements can be carried out in a laboratory or in the field, in the latter case using a field spectrometer. Reflectance curves are typically collected for the optical part of the electromagnetic spectrum and large efforts are made to store collections of typical curves in “spectral libraries”. The reflectance characteristics of some common land cover types are discussed in the following examples.
Examples
Vegetation
The reflectance characteristics of vegetation depend on the properties of the leaves, including the orientation and structure of the leaf canopy. The amount of radiation reflected for a particular wavelength depends on leaf pigmentation, thickness and composition (cell structure), and on the amount of water in the leaf tissue. Figure 1
shows an ideal reflectance curve of healthy vegetation. In the visible portion of the spectrum, the reflection of the blue and red components of incident light is comparatively low, because these portions are absorbed by the plant (mainly by chlorophyll) for photosynthesis; the vegetation reflects relatively more green light. The reflectance in the NIR range is highest, but the amount depends on leaf development and cell structure. In the SWIR range, reflectance is mainly determined by the free water in the leaf tissue; more free water results in less reflectance. Wavelengths around 1.45 μm and 1.95 μm are, therefore, called water absorption bands. The plant may change colour when its leaves dry out, for instance at harvest time for a crop (e.g. to yellow). At this stage there is no photosynthesis, which causes reflectance in the red portion of the spectrum to become higher. Also, the leaves will dry out, resulting in a higher reflectance of SWIR radiation, whereas reflectance in the NIR range may decrease. As a result, optical remote sensing can provide information about the type of plant and also about its health.

Bare soil
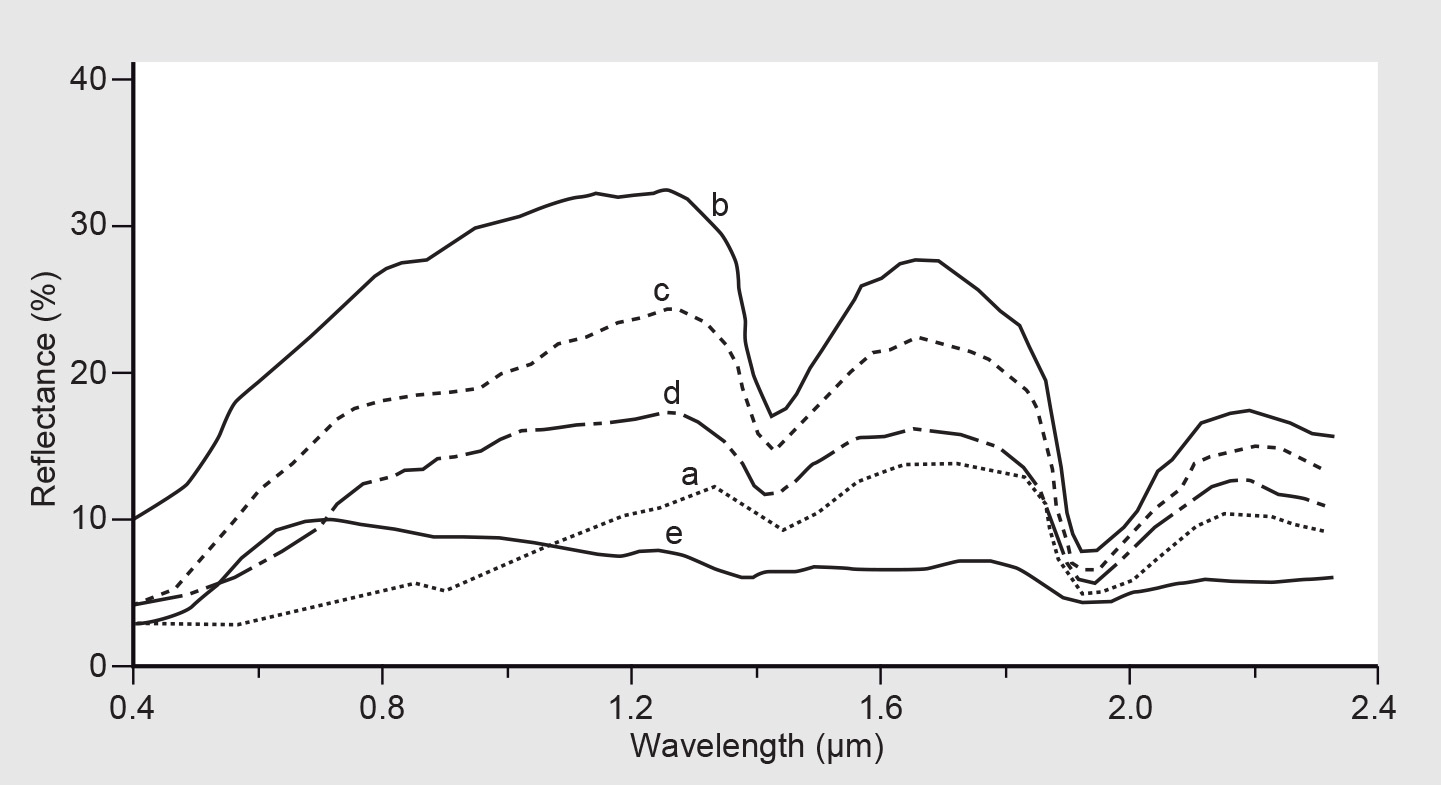
Reflectance from bare soil depends on so many factors that it is difficult to give one typical soil reflectance curve. The main factors influencing reflectance are soil colour, moisture content, the presence of carbonates, and iron oxide content. Figure 2 gives the reflectance curves for the five main types of soil occurring in the U.S.A.

Note the typical shapes of most of the curves, which are convex shape in the range 0.5–1.3 μm and dip at 1.45 μm and 1.95 μm. These dips correspond to water absorption bands and are caused by the presence of soil moisture. Iron-dominated soil (e) has quite a different reflectance curve since iron absorption dominates at longer wavelengths.
Water
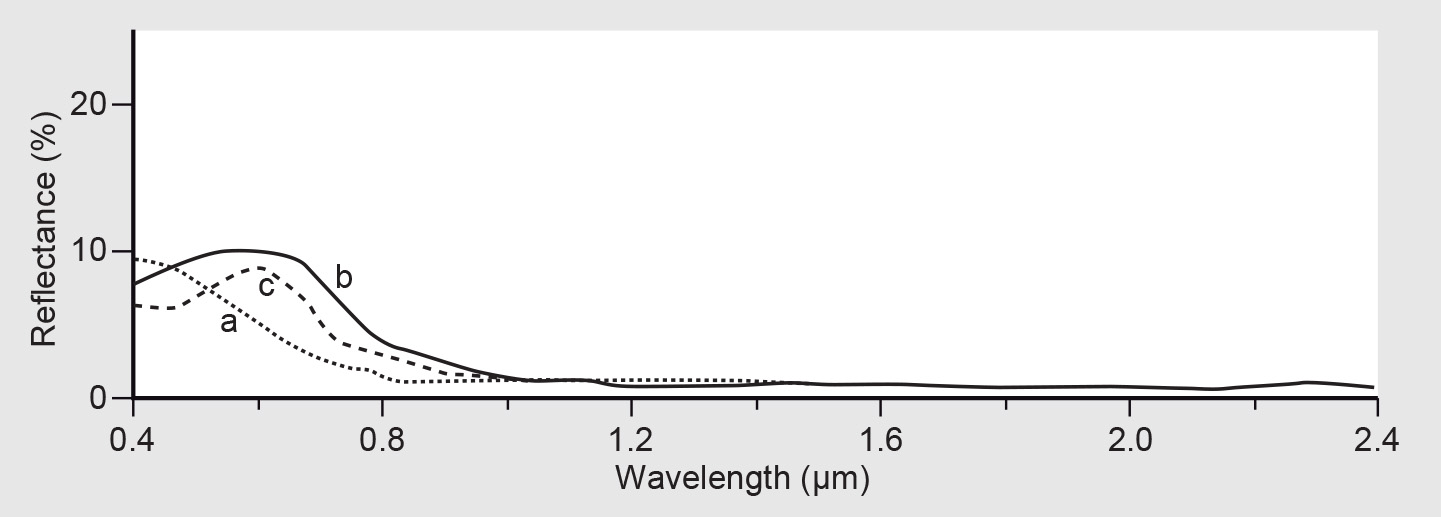
Compared to vegetation and soils, water has a lower reflectance. Vegetation may reflect up to 50% and soils up to 30–40%, while water reflects at most 10% of the incident radiation. Water reflects EM radiation in the visible range and a little in the NIR range. Beyond 1.2 μm, all radiation is absorbed. Spectral reflection curves for water of different compositions are given in Figure 3.

reflectance: (a) ocean water, (b) turbid water, (c) water with
chlorophyll (from [71]).
Turbid (silt loaded) water has the highest reflectance. Water containing plants or algae has a pronounced reflectance peak for
green light because of the chlorophyll present.
How to
A video with instructions in ILWIS can be found here:
https://canvas.utwente.nl/courses/4032/pages/physics-electro-magnetic-radiation?module_item_id=91201
See also NDVI
Synonyms
Spectral signature
Outgoing relations
- Spectral reflectance curves is same as Spectral reflectance
- Spectral reflectance curves is used by Observation model