Image display
Introduction
We normally display a digital image using a grey scale. A “digital image” can be raw data such as that obtained with a panchromatic camera, or data obtained by scanning a B&W photograph, or a single band of a multi-band image. For image display, standard computer monitors support 8 bits per pixel. Thus, if we have sensor recordings of 8 bits, each Digital Number (DN) can correspond to exactly one grey value. A pixel having the value zero will be shown as black, a pixel having the value 255 as white. Any DN in between becomes, therefore, some shade of grey. One to one correspondence between DN and grey value used to be the standard, so we still often use “grey value” as a synonym for DN. A colour monitor has three input channels, so we have to feed each of them with the same DN to obtain a “grey scale image”.
Explanation
An alternative way of displaying single-band data is to use a colour scale to obtain a pseudo-colour image. We can assign colours (ranging from blue via cyan, green and yellow to red) to different portions of the DN range 0–255. The use of pseudo-colour is especially useful for displaying data that are not reflection measurements. With thermal infrared data, for example, the association of cold versus warm with blue versus red is more intuitive than with dark versus bright.
When dealing with a multi-band image, any combination of three bands can, in principle, be used as input to the RGB channels of the monitor tio create a colour composite. The choice should be made based on the intended use of the image. Figure 1 indicates how we obtain a false colour composite. The most striking characteristic of false colour composites is that vegetation appears as a red-purple colour. In the visible part of the spectrum, plants reflect mostly green light, but their infrared reflection is even higher. Therefore, vegetation displays in a false colour composite as a combination of some blue and a lot of red, resulting in a reddish tint of purple.
Sometimes a true colour composite is made, where the RGB channels relate to the red, green and blue wavelength bands of a camera or multispectral scanner.
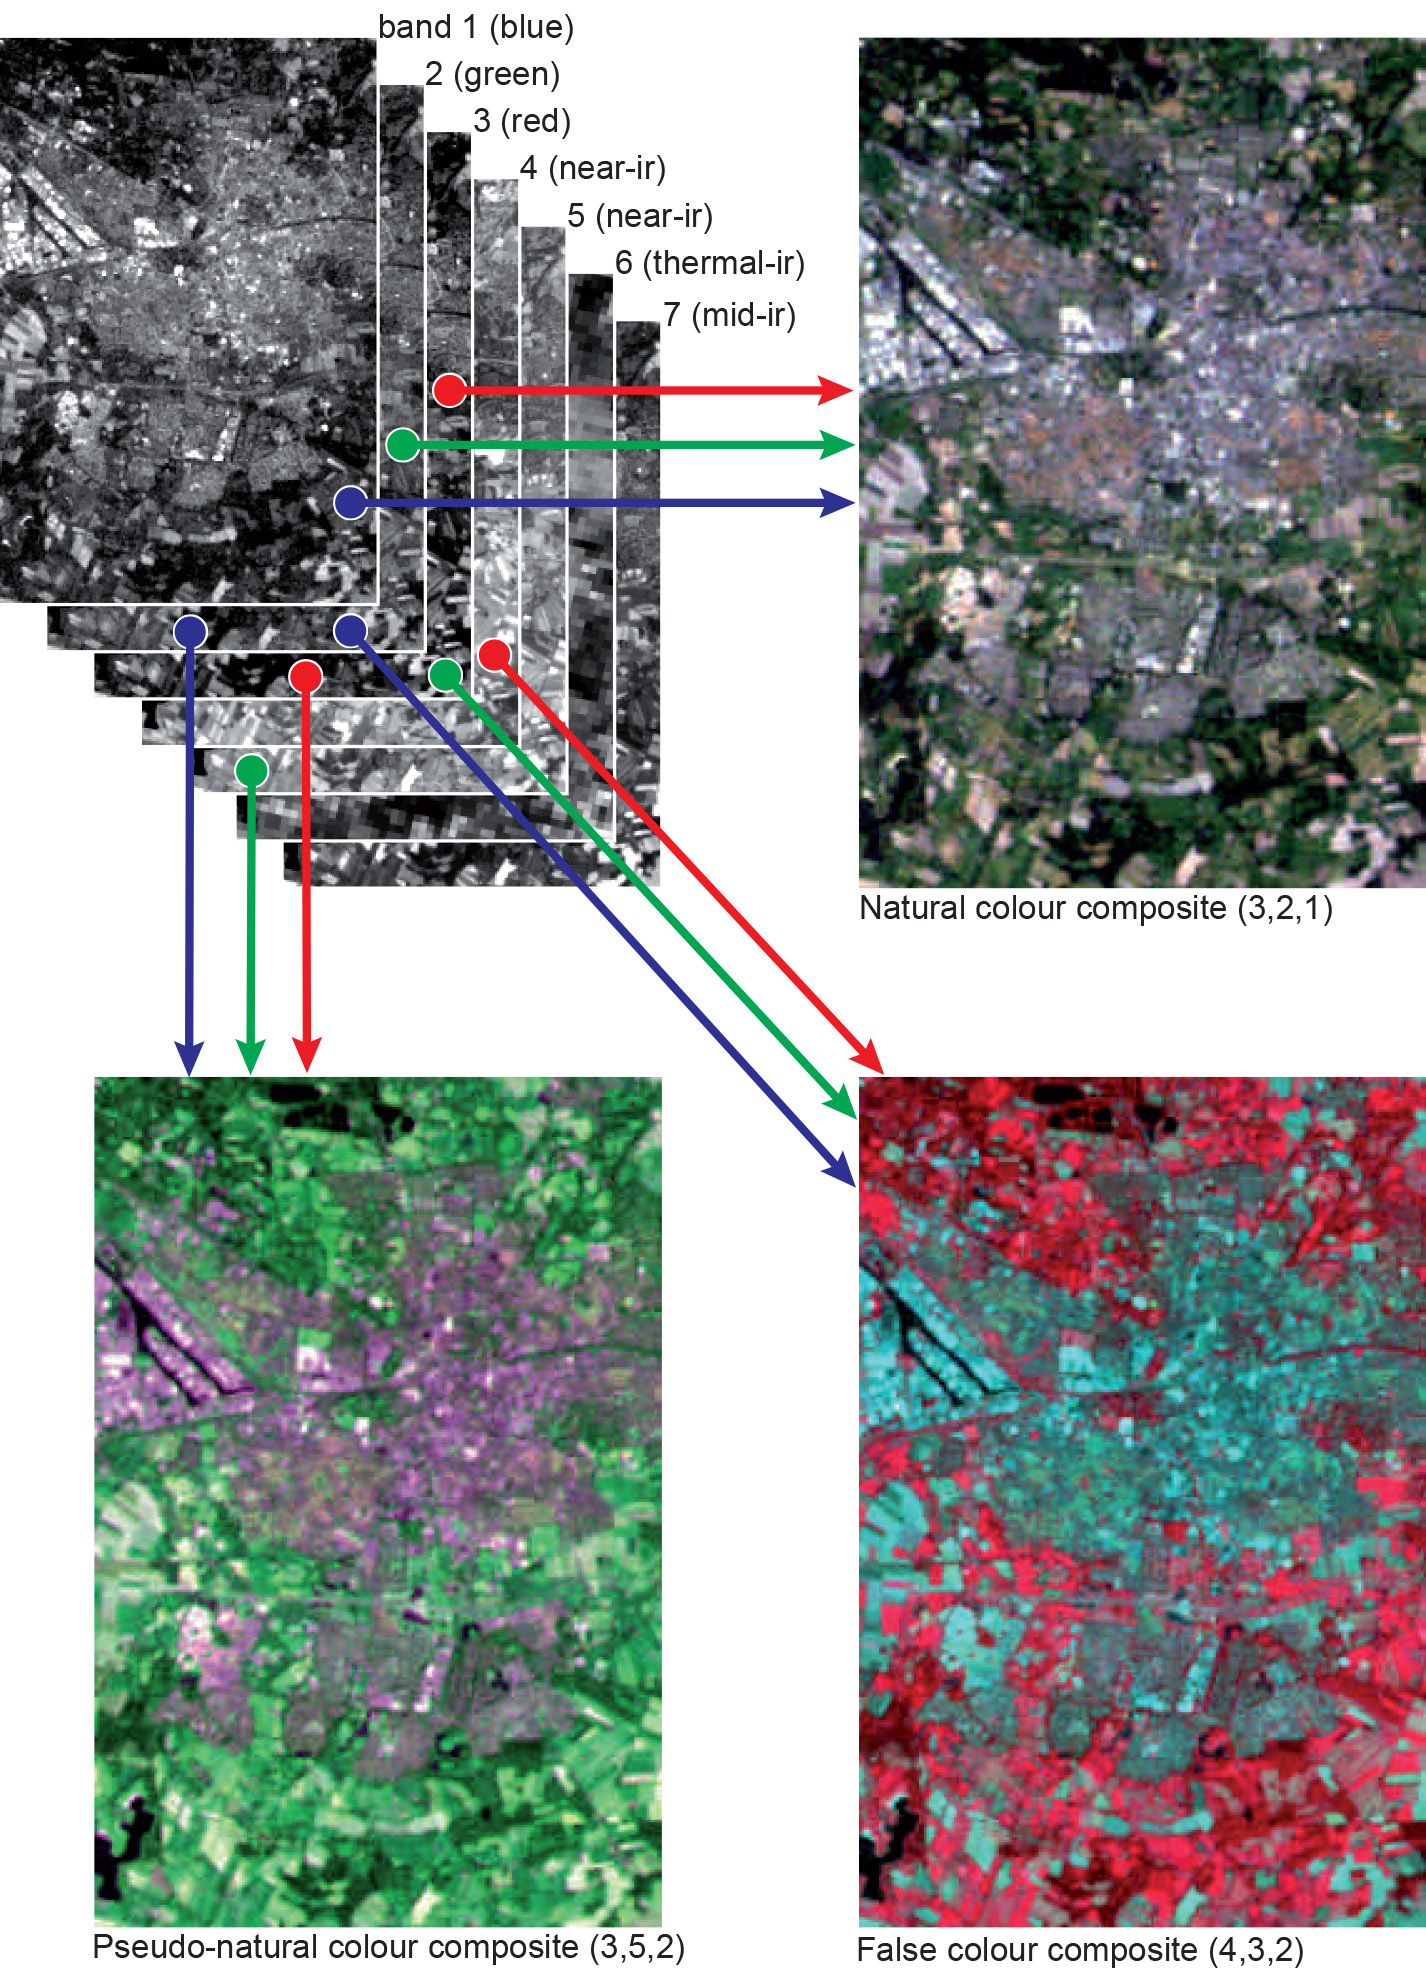
Depending on the application, band combinations other than true or false colour may be used. Land use categories can often be distinguished quite well by assigning a combination of Landsat-5 TM bands 5–4–3 or 4–5–3 to RGB.
Combinations that display NIR as green show vegetation in a green colour and are, therefore, often called pseudo-natural colour composites.
Note that there is no common consensus on the naming of certain composites (“true” may also be referred to as “natural”; “false colour” may also be used for other band combinations than green, red and NIR, etc.). Once you have become familiar with the additive mixing of the red, green and blue primaries, you can intuitively relate the colours—which you perceive on the computer monitor—to the digital numbers of the three input bands, thereby gaining a qualitative insight into the spectral properties of an imaged scene.
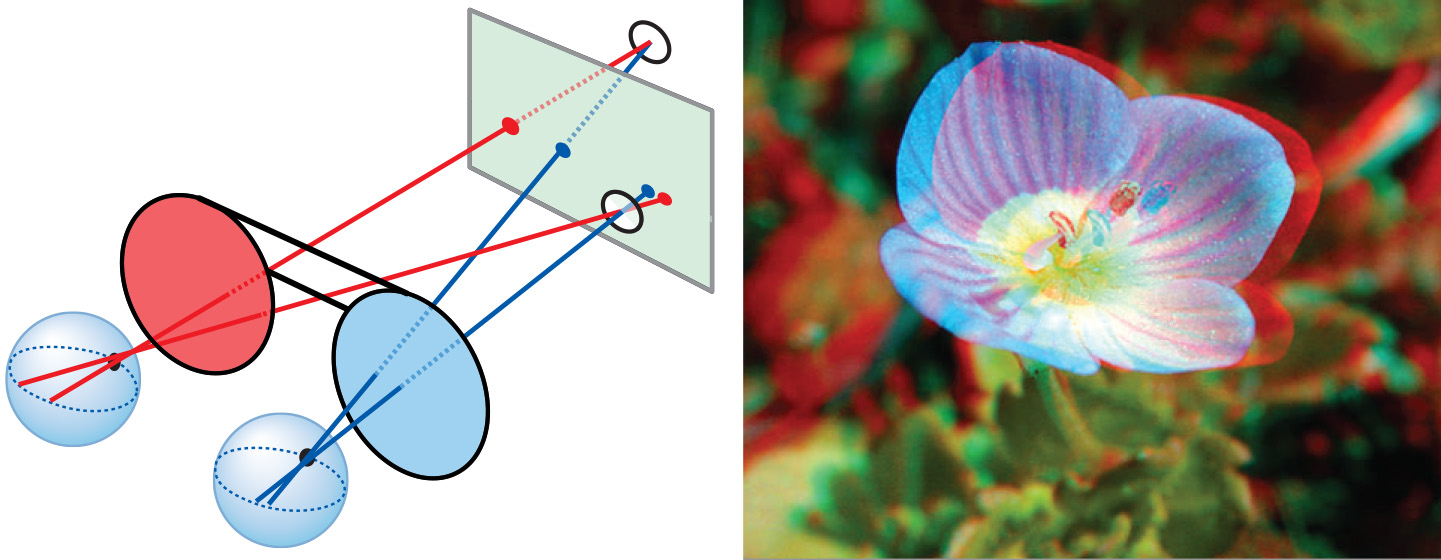
To obtain a 3D visual model from a stereo-image pair on a computer screen, we must combine the images into a stereograph (Figure 2) and then use a device that helps us to view the left image with the left eye and the right image with the right eye.
There are various technical solutions for this problem, one of which is the anaglyph method. The left image is displayed in red, the right one in cyan and the two images are superimposed. For viewing, you need spectacles with a red glass for the left eye and a cyan glass for the right eye. High-end digital photogrammetric systems use polarization instead of colour coding. Polarized spectacles make the images visible to the appropriate eye. The advantage of using polarized images is that we can display a full-colour stereo model and superimpose the results of measurements in any colour. Yet another approach is to use a “split screen” display and a stereoscope in front of the monitor.
A stereoscope is a device consisting of a pair of binoculars and two mirrors, which allows two images positioned next to each other to be viewed simultaneously, thus achieving stereoscopic vision. Stereoscopes can also be used to view paper prints of stereo photographs.
Prior knowledge
Outgoing relations
- Image display is based on Human Vision
- Image display is defined by Image enhancement
Incoming relations
- Pseudo colour is a kind of Image display
- True colour is a kind of Image display
- Image is used by Image display
- Tri-stimuli theory is used by Image display